

Copyright © National Academy of Sciences. All rights reserved.
Solar and Space Physics: A Science for a Technological Society
APPENDIX E
367
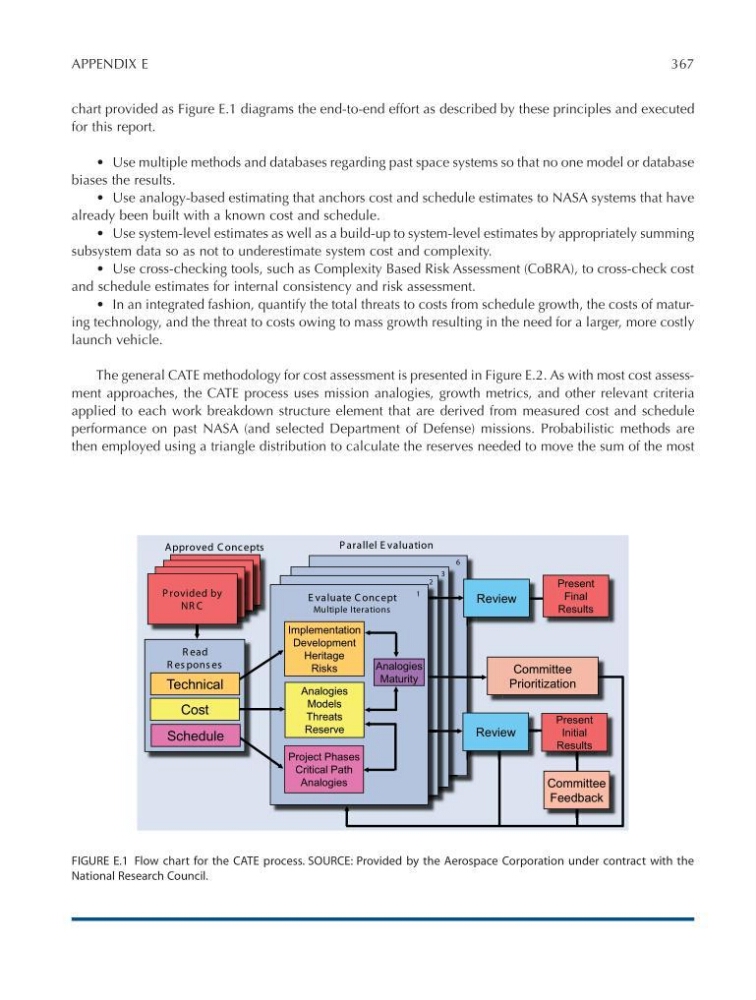
chart provided as Figure E.1 diagrams the end-to-end effort as described by these principles and executed
for this report.
• Use multiple methods and databases regarding past space systems so that no one model or database
biases the results.
• Use analogy-based estimating that anchors cost and schedule estimates to NASA systems that have
already been built with a known cost and schedule.
• Use system-level estimates as well as a build-up to system-level estimates by appropriately summing
subsystem data so as not to underestimate system cost and complexity.
• Use cross-checking tools, such as Complexity Based Risk Assessment (CoBRA), to cross-check cost
and schedule estimates for internal consistency and risk assessment.
• In an integrated fashion, quantify the total threats to costs from schedule growth, the costs of maturing technology, and the threat to costs owing to mass growth resulting in the need for a larger, more costly
launch vehicle.
The general CATE methodology for cost assessment is presented in Figure E.2. As with most cost assessment approaches, the CATE process uses mission analogies, growth metrics, and other relevant criteria
applied to each work breakdown structure element that are derived from measured cost and schedule
performance on past NASA (and selected Department of Defense) missions. Probabilistic methods are
then employed using a triangle distribution to calculate the reserves needed to move the sum of the most
FIGURE E.1 Flow chart for the CATE process. SOURCE: Provided by the Aerospace Corporation under contract with the
National Research Council.
F our P anels
2 to 7 C oncepts E ach
Approved C onc epts
2
3
6
Present
Initial
Results
F our P anels
2 to 7 C oncepts E ach
F our P anels
2 to 7 C oncepts E ach
h
l
F our P anels
2 to 7 C onc epts E ac h
P rovided by
NR C
P arallel E valuation
Committee
Feedback
Review
Committee
Prioritization
Review
Present
Final
Results
R ead
R es pons es
E valuate C onc ept
Multiple Iterations
Implementation
Development
Heritage
Risks
Analogies
Models
Threats
Reserve
Project Phases
Critical Path
Analogies
Analogies
Maturity
1
Technical
Cost
Schedule
Figure E-1
Solar and Space Physics: A Science for a Technological Society
APPENDIX E
367
chart provided as Figure E.1 diagrams the end-to-end effort as described by these principles and executed
for this report.
• Use multiple methods and databases regarding past space systems so that no one model or database
biases the results.
• Use analogy-based estimating that anchors cost and schedule estimates to NASA systems that have
already been built with a known cost and schedule.
• Use system-level estimates as well as a build-up to system-level estimates by appropriately summing
subsystem data so as not to underestimate system cost and complexity.
• Use cross-checking tools, such as Complexity Based Risk Assessment (CoBRA), to cross-check cost
and schedule estimates for internal consistency and risk assessment.
• In an integrated fashion, quantify the total threats to costs from schedule growth, the costs of maturing technology, and the threat to costs owing to mass growth resulting in the need for a larger, more costly
launch vehicle.
The general CATE methodology for cost assessment is presented in Figure E.2. As with most cost assessment approaches, the CATE process uses mission analogies, growth metrics, and other relevant criteria
applied to each work breakdown structure element that are derived from measured cost and schedule
performance on past NASA (and selected Department of Defense) missions. Probabilistic methods are
then employed using a triangle distribution to calculate the reserves needed to move the sum of the most
FIGURE E.1 Flow chart for the CATE process. SOURCE: Provided by the Aerospace Corporation under contract with the
National Research Council.
F our P anels
2 to 7 C oncepts E ach
Approved C onc epts
2
3
6
Present
Initial
Results
F our P anels
2 to 7 C oncepts E ach
F our P anels
2 to 7 C oncepts E ach
h
l
F our P anels
2 to 7 C onc epts E ac h
P rovided by
NR C
P arallel E valuation
Committee
Feedback
Review
Committee
Prioritization
Review
Present
Final
Results
R ead
R es pons es
E valuate C onc ept
Multiple Iterations
Implementation
Development
Heritage
Risks
Analogies
Models
Threats
Reserve
Project Phases
Critical Path
Analogies
Analogies
Maturity
1
Technical
Cost
Schedule
Figure E-1