

Copyright © National Academy of Sciences. All rights reserved.
Solar and Space Physics: A Science for a Technological Society
REPORT OF THE PANEL ON SOLAR AND HELIOSPHERIC PHYSICS
277
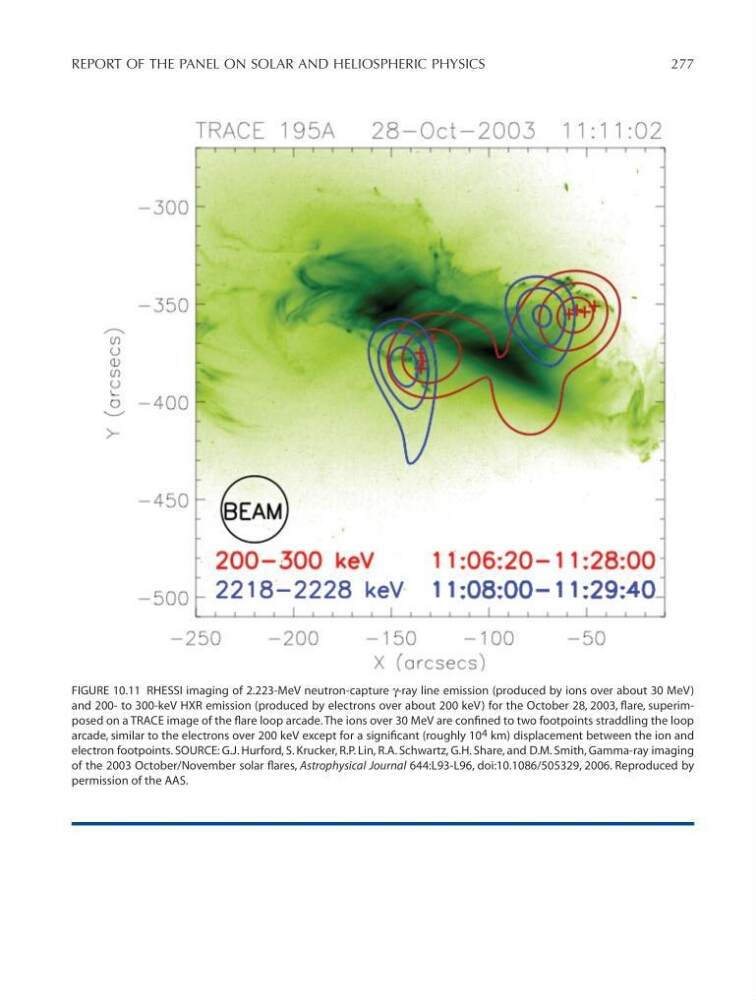
FIGURE 10.11 RHESSI imaging of 2.223-MeV neutron-capture g-ray line emission (produced by ions over about 30 MeV)
and 200- to 300-keV HXR emission (produced by electrons over about 200 keV) for the October 28, 2003, flare, superimposed on a TRACE image of the flare loop arcade. The ions over 30 MeV are confined to two footpoints straddling the loop
arcade, similar to the electrons over 200 keV except for a significant (roughly 10 4 km) displacement between the ion and
electron footpoints. SOURCE: G.J. Hurford, S. Krucker, R.P. Lin, R.A. Schwartz, G.H. Share, and D.M. Smith, Gamma-ray imaging
of the 2003 October/November solar flares, Astrophysical Journal 644:L93-L96, doi:10.1086/505329, 2006. Reproduced by
permission of the AAS.
Figure 10-11
Solar and Space Physics: A Science for a Technological Society
REPORT OF THE PANEL ON SOLAR AND HELIOSPHERIC PHYSICS
277
FIGURE 10.11 RHESSI imaging of 2.223-MeV neutron-capture g-ray line emission (produced by ions over about 30 MeV)
and 200- to 300-keV HXR emission (produced by electrons over about 200 keV) for the October 28, 2003, flare, superimposed on a TRACE image of the flare loop arcade. The ions over 30 MeV are confined to two footpoints straddling the loop
arcade, similar to the electrons over 200 keV except for a significant (roughly 10 4 km) displacement between the ion and
electron footpoints. SOURCE: G.J. Hurford, S. Krucker, R.P. Lin, R.A. Schwartz, G.H. Share, and D.M. Smith, Gamma-ray imaging
of the 2003 October/November solar flares, Astrophysical Journal 644:L93-L96, doi:10.1086/505329, 2006. Reproduced by
permission of the AAS.
Figure 10-11