

Copyright © National Academy of Sciences. All rights reserved.
Solar and Space Physics: A Science for a Technological Society
NASA PROGRAM IMPLEMENTATION
127
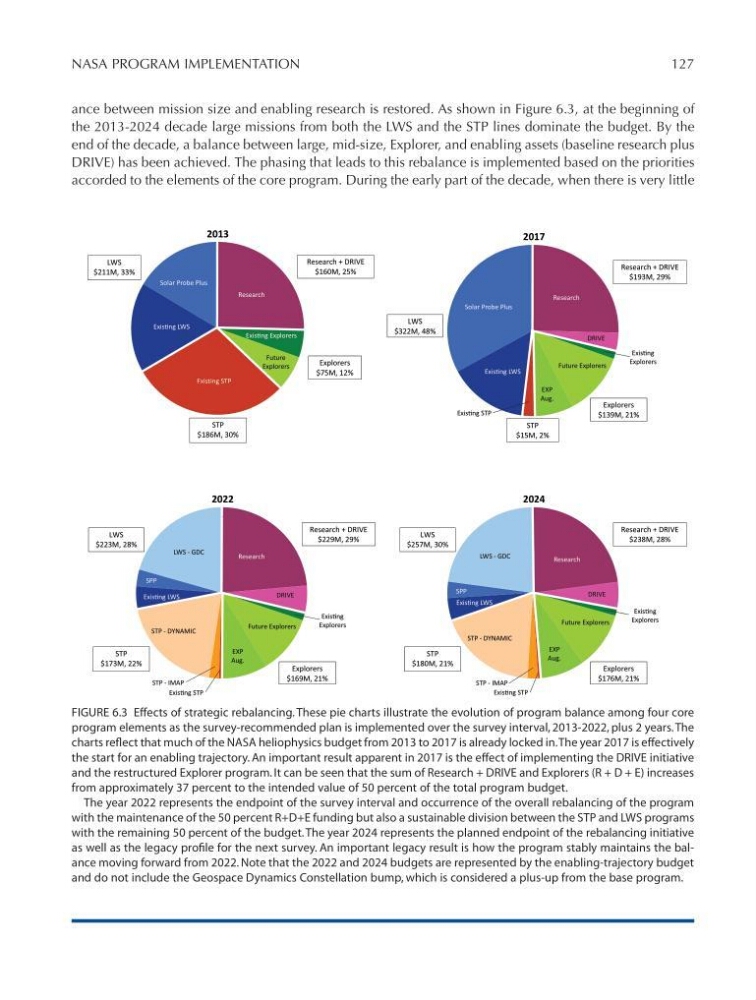
ance between mission size and enabling research is restored. As shown in Figure 6.3, at the beginning of
the 2013-2024 decade large missions from both the LWS and the STP lines dominate the budget. By the
end of the decade, a balance between large, mid-size, Explorer, and enabling assets (baseline research plus
DRIVE) has been achieved. The phasing that leads to this rebalance is implemented based on the priorities
accorded to the elements of the core program. During the early part of the decade, when there is very little
FIGURE 6.3 Effects of strategic rebalancing. These pie charts illustrate the evolution of program balance among four core
program elements as the survey-recommended plan is implemented over the survey interval, 2013-2022, plus 2 years. The
charts reflect that much of the NASA heliophysics budget from 2013 to 2017 is already locked in. The year 2017 is effectively
the start for an enabling trajectory. An important result apparent in 2017 is the effect of implementing the DRIVE initiative
and the restructured Explorer program. It can be seen that the sum of Research + DRIVE and Explorers (R + D + E) increases
from approximately 37 percent to the intended value of 50 percent of the total program budget.
The year 2022 represents the endpoint of the survey interval and occurrence of the overall rebalancing of the program
with the maintenance of the 50 percent R+D+E funding but also a sustainable division between the STP and LWS programs
with the remaining 50 percent of the budget. The year 2024 represents the planned endpoint of the rebalancing initiative
as well as the legacy profile for the next survey. An important legacy result is how the program stably maintains the balance moving forward from 2022. Note that the 2022 and 2024 budgets are represented by the enabling-trajectory budget
and do not include the Geospace Dynamics Constellation bump, which is considered a plus-up from the base program.
2022
Research + DRIVE
$229M, 29%
LWS
$223M, 28%
Research
SPP
LWS - GDC
DRIVE
ExisƟng LWS
SPP
ExisƟng
Explorers
Future Explorers
STP - DYNAMIC
EXP
Aug.
Explorers
$169M 21%
STP
$173M, 22%
ExisƟng STP
STP - IMAP
$169M, 21%
2024
Research + DRIVE
$238M, 28%
LWS
$257M, 30%
Research
LWS - GDC
DRIVE
ExisƟng
ExisƟng LWS
SPP
g
Explorers
Future Explorers
STP - DYNAMIC
EXP
Aug.
Explorers
$176M 21%
STP
$180M, 21%
ExisƟng STP
STP - IMAP
$176M, 21%
2013
Solar Probe Plus
Research + DRIVE
$160M, 25%
LWS
$211M, 33%
Research
ExisƟng Explorers
ExisƟng LWS
Future
Explorers
Existing STP
Explorers
$75M, 12%
st g S
STP
$186M, 30%
LWS - GDC
2017
Research + DRIVE
$193M, 29%
Research
Solar Probe Plus
LWS
DRIVE
E i Ɵ
LWS
$322M, 48%
ExisƟng
Explorers
Future Explorers
ExisƟng LWS
EXP
Aug.
ExisƟng STP
Explorers
$139M 21%
g
STP - IMAP
$139M, 21%
STP
$15M, 2%
Figure 6-3 combined
Solar and Space Physics: A Science for a Technological Society
NASA PROGRAM IMPLEMENTATION
127
ance between mission size and enabling research is restored. As shown in Figure 6.3, at the beginning of
the 2013-2024 decade large missions from both the LWS and the STP lines dominate the budget. By the
end of the decade, a balance between large, mid-size, Explorer, and enabling assets (baseline research plus
DRIVE) has been achieved. The phasing that leads to this rebalance is implemented based on the priorities
accorded to the elements of the core program. During the early part of the decade, when there is very little
FIGURE 6.3 Effects of strategic rebalancing. These pie charts illustrate the evolution of program balance among four core
program elements as the survey-recommended plan is implemented over the survey interval, 2013-2022, plus 2 years. The
charts reflect that much of the NASA heliophysics budget from 2013 to 2017 is already locked in. The year 2017 is effectively
the start for an enabling trajectory. An important result apparent in 2017 is the effect of implementing the DRIVE initiative
and the restructured Explorer program. It can be seen that the sum of Research + DRIVE and Explorers (R + D + E) increases
from approximately 37 percent to the intended value of 50 percent of the total program budget.
The year 2022 represents the endpoint of the survey interval and occurrence of the overall rebalancing of the program
with the maintenance of the 50 percent R+D+E funding but also a sustainable division between the STP and LWS programs
with the remaining 50 percent of the budget. The year 2024 represents the planned endpoint of the rebalancing initiative
as well as the legacy profile for the next survey. An important legacy result is how the program stably maintains the balance moving forward from 2022. Note that the 2022 and 2024 budgets are represented by the enabling-trajectory budget
and do not include the Geospace Dynamics Constellation bump, which is considered a plus-up from the base program.
2022
Research + DRIVE
$229M, 29%
LWS
$223M, 28%
Research
SPP
LWS - GDC
DRIVE
ExisƟng LWS
SPP
ExisƟng
Explorers
Future Explorers
STP - DYNAMIC
EXP
Aug.
Explorers
$169M 21%
STP
$173M, 22%
ExisƟng STP
STP - IMAP
$169M, 21%
2024
Research + DRIVE
$238M, 28%
LWS
$257M, 30%
Research
LWS - GDC
DRIVE
ExisƟng
ExisƟng LWS
SPP
g
Explorers
Future Explorers
STP - DYNAMIC
EXP
Aug.
Explorers
$176M 21%
STP
$180M, 21%
ExisƟng STP
STP - IMAP
$176M, 21%
2013
Solar Probe Plus
Research + DRIVE
$160M, 25%
LWS
$211M, 33%
Research
ExisƟng Explorers
ExisƟng LWS
Future
Explorers
Existing STP
Explorers
$75M, 12%
st g S
STP
$186M, 30%
LWS - GDC
2017
Research + DRIVE
$193M, 29%
Research
Solar Probe Plus
LWS
DRIVE
E i Ɵ
LWS
$322M, 48%
ExisƟng
Explorers
Future Explorers
ExisƟng LWS
EXP
Aug.
ExisƟng STP
Explorers
$139M 21%
g
STP - IMAP
$139M, 21%
STP
$15M, 2%
Figure 6-3 combined