

86
M. C. Ben Nasr et al.
3.2 Classifier Evaluation
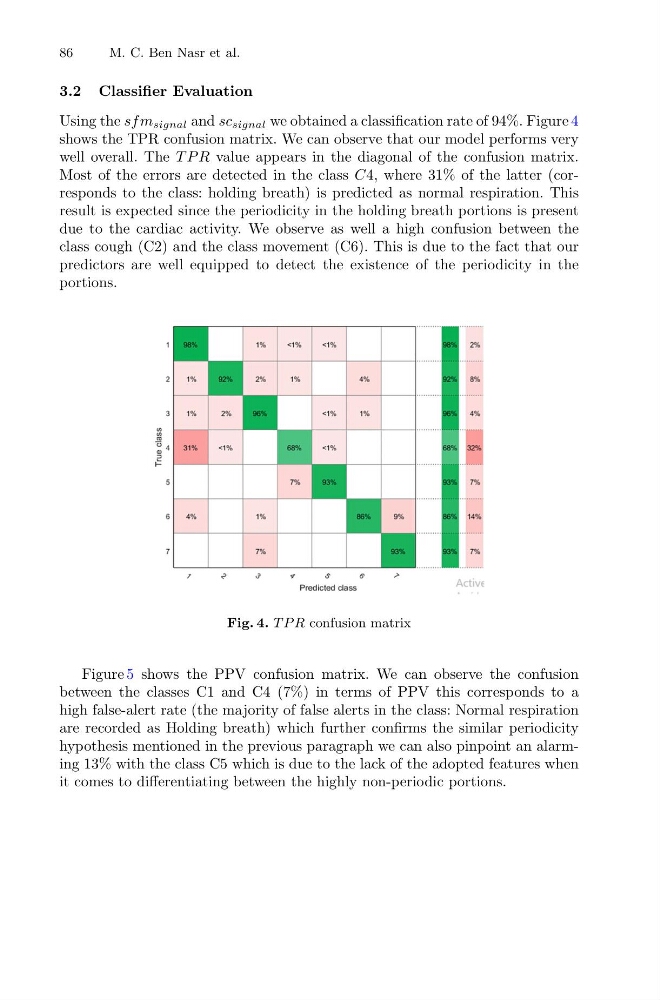
Using the sf m signal and sc signal we obtained a classification rate of 94%. Figure 4
shows the TPR confusion matrix. We can observe that our model performs very
well overall. The T P R value appears in the diagonal of the confusion matrix.
Most of the errors are detected in the class C4, where 31% of the latter (corresponds to the class: holding breath) is predicted as normal respiration. This
result is expected since the periodicity in the holding breath portions is present
due to the cardiac activity. We observe as well a high confusion between the
class cough (C2) and the class movement (C6). This is due to the fact that our
predictors are well equipped to detect the existence of the periodicity in the
portions.
Fig. 4. T P R confusion matrix
Figure 5 shows the PPV confusion matrix. We can observe the confusion
between the classes C1 and C4 (7%) in terms of PPV this corresponds to a
high false-alert rate (the majority of false alerts in the class: Normal respiration
are recorded as Holding breath) which further confirms the similar periodicity
hypothesis mentioned in the previous paragraph we can also pinpoint an alarming 13% with the class C5 which is due to the lack of the adopted features when
it comes to differentiating between the highly non-periodic portions.
M. C. Ben Nasr et al.
3.2 Classifier Evaluation
Using the sf m signal and sc signal we obtained a classification rate of 94%. Figure 4
shows the TPR confusion matrix. We can observe that our model performs very
well overall. The T P R value appears in the diagonal of the confusion matrix.
Most of the errors are detected in the class C4, where 31% of the latter (corresponds to the class: holding breath) is predicted as normal respiration. This
result is expected since the periodicity in the holding breath portions is present
due to the cardiac activity. We observe as well a high confusion between the
class cough (C2) and the class movement (C6). This is due to the fact that our
predictors are well equipped to detect the existence of the periodicity in the
portions.
Fig. 4. T P R confusion matrix
Figure 5 shows the PPV confusion matrix. We can observe the confusion
between the classes C1 and C4 (7%) in terms of PPV this corresponds to a
high false-alert rate (the majority of false alerts in the class: Normal respiration
are recorded as Holding breath) which further confirms the similar periodicity
hypothesis mentioned in the previous paragraph we can also pinpoint an alarming 13% with the class C5 which is due to the lack of the adopted features when
it comes to differentiating between the highly non-periodic portions.