

Respiratory Activity Classification
85
The closest values of the descriptors to the ideal ones (those of the normal
breathing) are the values recorded during the holding breath, this is due to the
fact that the portions of holding breath are periodic and carry only the heart
rhythm information.
Table 1. Mean value of SF M and SC during each activity.
Activities
SF M SC
Normal respiration (C1)
0.02
0.807
Cough (C2)
0.1582 2.3591
Post cough breathing (C3) 0.14
1.2638
Holding breath (C4)
0.102 0.7662
Movement
0.2293 1.4844
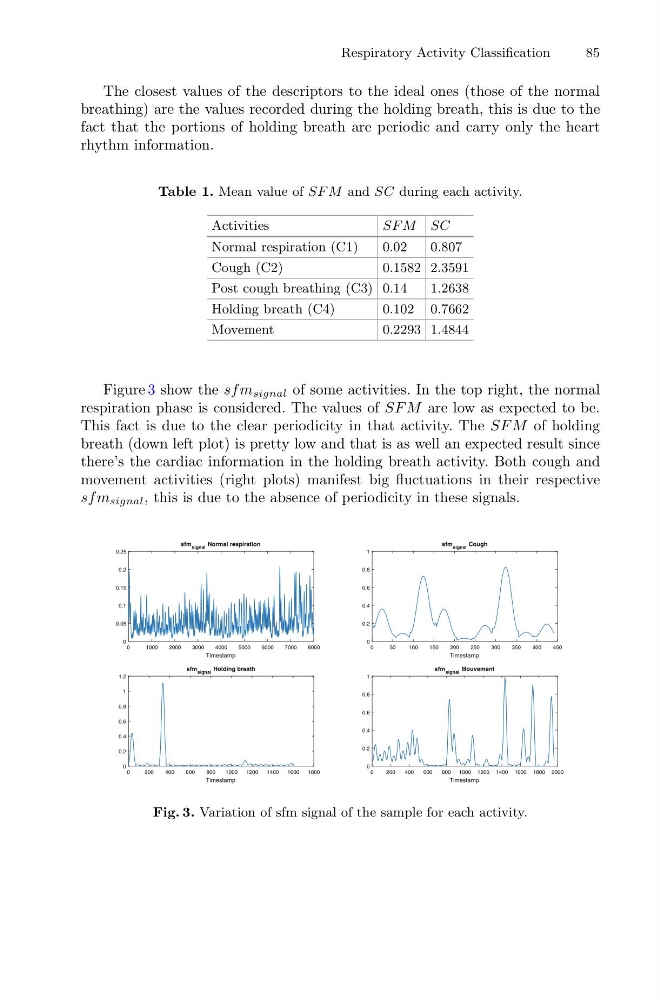
Figure 3 show the sf m signal of some activities. In the top right, the normal
respiration phase is considered. The values of SF M are low as expected to be.
This fact is due to the clear periodicity in that activity. The SF M of holding
breath (down left plot) is pretty low and that is as well an expected result since
there’s the cardiac information in the holding breath activity. Both cough and
movement activities (right plots) manifest big fluctuations in their respective
sf m signal , this is due to the absence of periodicity in these signals.
0
1000
2000
3000
4000
5000
6000
7000
8000
Timestamp
0
0.05
0.1
0.15
0.2
0.25
sfm signal Normal respiration
0
50
100
150
200
250
300
350
400
450
Timestamp
0
0.2
0.4
0.6
0.8
1
sfm signal Cough
0
200
400
600
800
1000
1200
1400
1600
1800
Timestamp
0
0.2
0.4
0.6
0.8
1
1.2
sfm signal Holding breath
0
200
400
600
800 1000 1200 1400 1600 1800 2000
Timestamp
0
0.2
0.4
0.6
0.8
1
sfm signal Mouvement
Fig. 3. Variation of sfm signal of the sample for each activity.
85
The closest values of the descriptors to the ideal ones (those of the normal
breathing) are the values recorded during the holding breath, this is due to the
fact that the portions of holding breath are periodic and carry only the heart
rhythm information.
Table 1. Mean value of SF M and SC during each activity.
Activities
SF M SC
Normal respiration (C1)
0.02
0.807
Cough (C2)
0.1582 2.3591
Post cough breathing (C3) 0.14
1.2638
Holding breath (C4)
0.102 0.7662
Movement
0.2293 1.4844
Figure 3 show the sf m signal of some activities. In the top right, the normal
respiration phase is considered. The values of SF M are low as expected to be.
This fact is due to the clear periodicity in that activity. The SF M of holding
breath (down left plot) is pretty low and that is as well an expected result since
there’s the cardiac information in the holding breath activity. Both cough and
movement activities (right plots) manifest big fluctuations in their respective
sf m signal , this is due to the absence of periodicity in these signals.
0
1000
2000
3000
4000
5000
6000
7000
8000
Timestamp
0
0.05
0.1
0.15
0.2
0.25
sfm signal Normal respiration
0
50
100
150
200
250
300
350
400
450
Timestamp
0
0.2
0.4
0.6
0.8
1
sfm signal Cough
0
200
400
600
800
1000
1200
1400
1600
1800
Timestamp
0
0.2
0.4
0.6
0.8
1
1.2
sfm signal Holding breath
0
200
400
600
800 1000 1200 1400 1600 1800 2000
Timestamp
0
0.2
0.4
0.6
0.8
1
sfm signal Mouvement
Fig. 3. Variation of sfm signal of the sample for each activity.