

4.5 The Composite Physical Well-Being Indicator
From several existing elementary statistical approaches for aggregating the underlying
dimensional indices and constructing the summary composite indicator value, we
consider the weighted geometric mean of the four constituting dimensional indices as
most adequate and appropriate for this specific well-being problematics:
WB ph ¼
4
ffiffiffiffiffiffiffiffiffiffiffiffiffiffiffiffiffiffiffiffiffiffiffiffiffiffiffiffiffiffiffiffiffiffiffiffiffiffiffiffiffiffiffi
I
Wt w
w à I
Wtp
p
à I
Wt s
s
à I
Wt c
c
q
;
ð2Þ
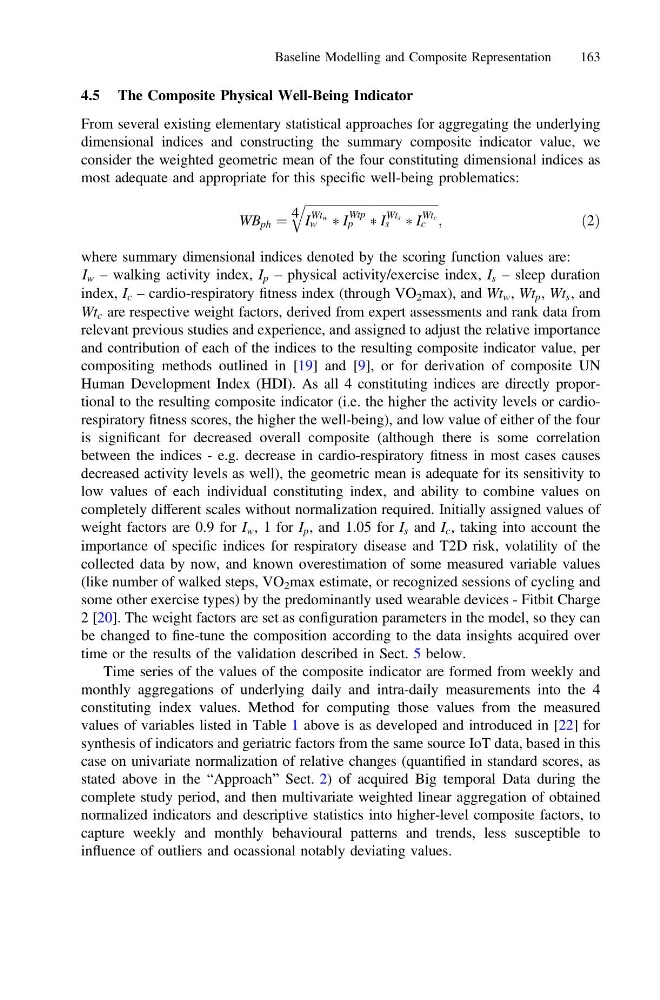
where summary dimensional indices denoted by the scoring function values are:
I w – walking activity index, I p – physical activity/exercise index, I s – sleep duration
index, I c – cardio-respiratory fitness index (through VO 2 max), and Wt w , Wt p , Wt s , and
Wt c are respective weight factors, derived from expert assessments and rank data from
relevant previous studies and experience, and assigned to adjust the relative importance
and contribution of each of the indices to the resulting composite indicator value, per
compositing methods outlined in [19] and [9], or for derivation of composite UN
Human Development Index (HDI). As all 4 constituting indices are directly proportional to the resulting composite indicator (i.e. the higher the activity levels or cardiorespiratory fitness scores, the higher the well-being), and low value of either of the four
is significant for decreased overall composite (although there is some correlation
between the indices - e.g. decrease in cardio-respiratory fitness in most cases causes
decreased activity levels as well), the geometric mean is adequate for its sensitivity to
low values of each individual constituting index, and ability to combine values on
completely different scales without normalization required. Initially assigned values of
weight factors are 0.9 for I w , 1 for I p , and 1.05 for I s and I c , taking into account the
importance of specific indices for respiratory disease and T2D risk, volatility of the
collected data by now, and known overestimation of some measured variable values
(like number of walked steps, VO 2 max estimate, or recognized sessions of cycling and
some other exercise types) by the predominantly used wearable devices - Fitbit Charge
2 [20]. The weight factors are set as configuration parameters in the model, so they can
be changed to fine-tune the composition according to the data insights acquired over
time or the results of the validation described in Sect. 5 below.
Time series of the values of the composite indicator are formed from weekly and
monthly aggregations of underlying daily and intra-daily measurements into the 4
constituting index values. Method for computing those values from the measured
values of variables listed in Table 1 above is as developed and introduced in [22] for
synthesis of indicators and geriatric factors from the same source IoT data, based in this
case on univariate normalization of relative changes (quantified in standard scores, as
stated above in the “Approach” Sect. 2) of acquired Big temporal Data during the
complete study period, and then multivariate weighted linear aggregation of obtained
normalized indicators and descriptive statistics into higher-level composite factors, to
capture weekly and monthly behavioural patterns and trends, less susceptible to
influence of outliers and ocassional notably deviating values.
Baseline Modelling and Composite Representation
163
From several existing elementary statistical approaches for aggregating the underlying
dimensional indices and constructing the summary composite indicator value, we
consider the weighted geometric mean of the four constituting dimensional indices as
most adequate and appropriate for this specific well-being problematics:
WB ph ¼
4
ffiffiffiffiffiffiffiffiffiffiffiffiffiffiffiffiffiffiffiffiffiffiffiffiffiffiffiffiffiffiffiffiffiffiffiffiffiffiffiffiffiffiffi
I
Wt w
w à I
Wtp
p
à I
Wt s
s
à I
Wt c
c
q
;
ð2Þ
where summary dimensional indices denoted by the scoring function values are:
I w – walking activity index, I p – physical activity/exercise index, I s – sleep duration
index, I c – cardio-respiratory fitness index (through VO 2 max), and Wt w , Wt p , Wt s , and
Wt c are respective weight factors, derived from expert assessments and rank data from
relevant previous studies and experience, and assigned to adjust the relative importance
and contribution of each of the indices to the resulting composite indicator value, per
compositing methods outlined in [19] and [9], or for derivation of composite UN
Human Development Index (HDI). As all 4 constituting indices are directly proportional to the resulting composite indicator (i.e. the higher the activity levels or cardiorespiratory fitness scores, the higher the well-being), and low value of either of the four
is significant for decreased overall composite (although there is some correlation
between the indices - e.g. decrease in cardio-respiratory fitness in most cases causes
decreased activity levels as well), the geometric mean is adequate for its sensitivity to
low values of each individual constituting index, and ability to combine values on
completely different scales without normalization required. Initially assigned values of
weight factors are 0.9 for I w , 1 for I p , and 1.05 for I s and I c , taking into account the
importance of specific indices for respiratory disease and T2D risk, volatility of the
collected data by now, and known overestimation of some measured variable values
(like number of walked steps, VO 2 max estimate, or recognized sessions of cycling and
some other exercise types) by the predominantly used wearable devices - Fitbit Charge
2 [20]. The weight factors are set as configuration parameters in the model, so they can
be changed to fine-tune the composition according to the data insights acquired over
time or the results of the validation described in Sect. 5 below.
Time series of the values of the composite indicator are formed from weekly and
monthly aggregations of underlying daily and intra-daily measurements into the 4
constituting index values. Method for computing those values from the measured
values of variables listed in Table 1 above is as developed and introduced in [22] for
synthesis of indicators and geriatric factors from the same source IoT data, based in this
case on univariate normalization of relative changes (quantified in standard scores, as
stated above in the “Approach” Sect. 2) of acquired Big temporal Data during the
complete study period, and then multivariate weighted linear aggregation of obtained
normalized indicators and descriptive statistics into higher-level composite factors, to
capture weekly and monthly behavioural patterns and trends, less susceptible to
influence of outliers and ocassional notably deviating values.
Baseline Modelling and Composite Representation
163