

Additionally, relevant recent findings like the extensive meta-analysis performed by
the American Diabetes Association to assess the dose-response relationship between
sleep duration and risk of type 2 diabetes [18], have concluded that the lowest type 2
diabetes risk is for the average overnight sleep duration from 7 to under 9 h per day,
and that both shorter and longer sleep durations than this optimum range denote up to
1.5 times increased risk (and up to 2 times increased cardiac conditions risk shown in
the related studies [21], also relevant in the Project). We therefore slightly alter the may
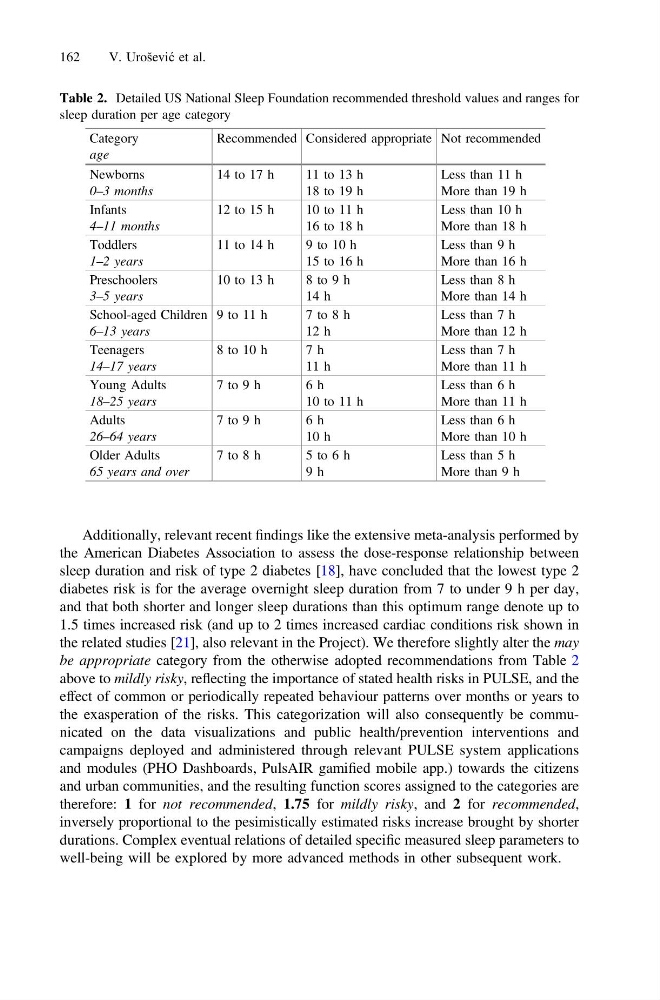
be appropriate category from the otherwise adopted recommendations from Table 2
above to mildly risky, reflecting the importance of stated health risks in PULSE, and the
effect of common or periodically repeated behaviour patterns over months or years to
the exasperation of the risks. This categorization will also consequently be communicated on the data visualizations and public health/prevention interventions and
campaigns deployed and administered through relevant PULSE system applications
and modules (PHO Dashboards, PulsAIR gamified mobile app.) towards the citizens
and urban communities, and the resulting function scores assigned to the categories are
therefore: 1 for not recommended, 1.75 for mildly risky, and 2 for recommended,
inversely proportional to the pesimistically estimated risks increase brought by shorter
durations. Complex eventual relations of detailed specific measured sleep parameters to
well-being will be explored by more advanced methods in other subsequent work.
Table 2. Detailed US National Sleep Foundation recommended threshold values and ranges for
sleep duration per age category
Category
age
Recommended Considered appropriate Not recommended
Newborns
0–3 months
14 to 17 h
11 to 13 h
18 to 19 h
Less than 11 h
More than 19 h
Infants
4–11 months
12 to 15 h
10 to 11 h
16 to 18 h
Less than 10 h
More than 18 h
Toddlers
1–2 years
11 to 14 h
9 to 10 h
15 to 16 h
Less than 9 h
More than 16 h
Preschoolers
3–5 years
10 to 13 h
8 to 9 h
14 h
Less than 8 h
More than 14 h
School-aged Children
6–13 years
9 to 11 h
7 to 8 h
12 h
Less than 7 h
More than 12 h
Teenagers
14–17 years
8 to 10 h
7 h
11 h
Less than 7 h
More than 11 h
Young Adults
18–25 years
7 to 9 h
6 h
10 to 11 h
Less than 6 h
More than 11 h
Adults
26–64 years
7 to 9 h
6 h
10 h
Less than 6 h
More than 10 h
Older Adults
65 years and over
7 to 8 h
5 to 6 h
9 h
Less than 5 h
More than 9 h
162
V. Urošević et al.
the American Diabetes Association to assess the dose-response relationship between
sleep duration and risk of type 2 diabetes [18], have concluded that the lowest type 2
diabetes risk is for the average overnight sleep duration from 7 to under 9 h per day,
and that both shorter and longer sleep durations than this optimum range denote up to
1.5 times increased risk (and up to 2 times increased cardiac conditions risk shown in
the related studies [21], also relevant in the Project). We therefore slightly alter the may
be appropriate category from the otherwise adopted recommendations from Table 2
above to mildly risky, reflecting the importance of stated health risks in PULSE, and the
effect of common or periodically repeated behaviour patterns over months or years to
the exasperation of the risks. This categorization will also consequently be communicated on the data visualizations and public health/prevention interventions and
campaigns deployed and administered through relevant PULSE system applications
and modules (PHO Dashboards, PulsAIR gamified mobile app.) towards the citizens
and urban communities, and the resulting function scores assigned to the categories are
therefore: 1 for not recommended, 1.75 for mildly risky, and 2 for recommended,
inversely proportional to the pesimistically estimated risks increase brought by shorter
durations. Complex eventual relations of detailed specific measured sleep parameters to
well-being will be explored by more advanced methods in other subsequent work.
Table 2. Detailed US National Sleep Foundation recommended threshold values and ranges for
sleep duration per age category
Category
age
Recommended Considered appropriate Not recommended
Newborns
0–3 months
14 to 17 h
11 to 13 h
18 to 19 h
Less than 11 h
More than 19 h
Infants
4–11 months
12 to 15 h
10 to 11 h
16 to 18 h
Less than 10 h
More than 18 h
Toddlers
1–2 years
11 to 14 h
9 to 10 h
15 to 16 h
Less than 9 h
More than 16 h
Preschoolers
3–5 years
10 to 13 h
8 to 9 h
14 h
Less than 8 h
More than 14 h
School-aged Children
6–13 years
9 to 11 h
7 to 8 h
12 h
Less than 7 h
More than 12 h
Teenagers
14–17 years
8 to 10 h
7 h
11 h
Less than 7 h
More than 11 h
Young Adults
18–25 years
7 to 9 h
6 h
10 to 11 h
Less than 6 h
More than 11 h
Adults
26–64 years
7 to 9 h
6 h
10 h
Less than 6 h
More than 10 h
Older Adults
65 years and over
7 to 8 h
5 to 6 h
9 h
Less than 5 h
More than 9 h
162
V. Urošević et al.