

rate in medical statistics and more specifically in the field of ECG signals classification.
Indeed, within our proposed ANN, we have an excellent rate of classification as seen in
the ROC and a perfect prediction would yield an AUC of 0.93, presenting a value close
to 1 for the training process, blue coloured in the curve. Similarly, test and validation
process present high accuracy rate according to the curve.
3.2.4 Cross Entropy Results
Table 3 shows the cross entropy and errors result through the training, the validation
and the testing neural network process. Indeed, it is important to have low values of
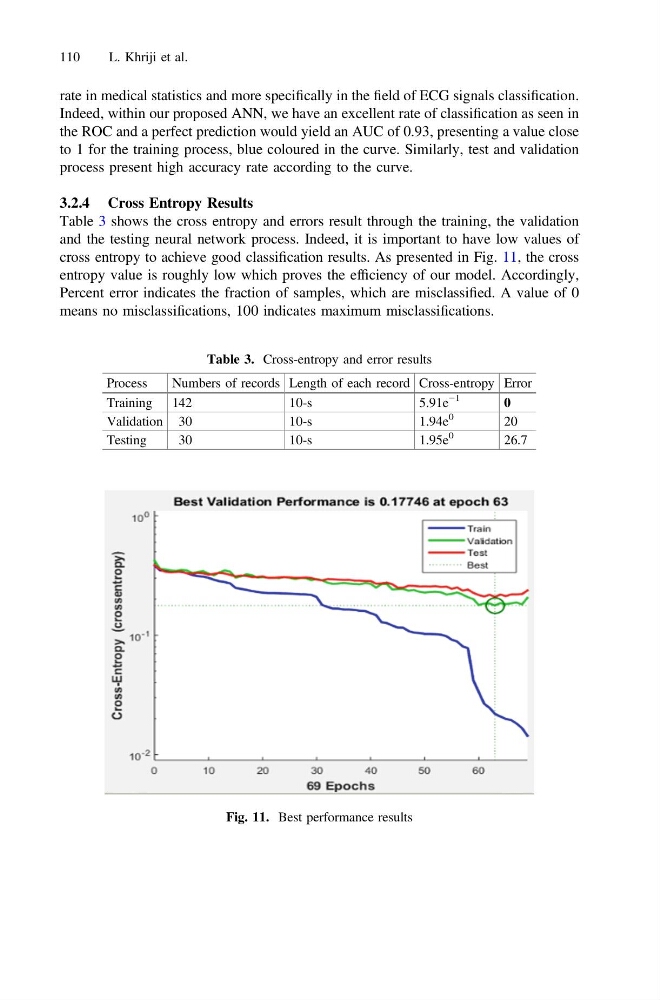
cross entropy to achieve good classification results. As presented in Fig. 11, the cross
entropy value is roughly low which proves the efficiency of our model. Accordingly,
Percent error indicates the fraction of samples, which are misclassified. A value of 0
means no misclassifications, 100 indicates maximum misclassifications.
Table 3. Cross-entropy and error results
Process
Numbers of records Length of each record Cross-entropy Error
Training 142
10-s
5.91e
−1
0
Validation 30
10-s
1.94e
0
20
Testing
30
10-s
1.95e
0
26.7
Fig. 11. Best performance results
110
L. Khriji et al.
Indeed, within our proposed ANN, we have an excellent rate of classification as seen in
the ROC and a perfect prediction would yield an AUC of 0.93, presenting a value close
to 1 for the training process, blue coloured in the curve. Similarly, test and validation
process present high accuracy rate according to the curve.
3.2.4 Cross Entropy Results
Table 3 shows the cross entropy and errors result through the training, the validation
and the testing neural network process. Indeed, it is important to have low values of
cross entropy to achieve good classification results. As presented in Fig. 11, the cross
entropy value is roughly low which proves the efficiency of our model. Accordingly,
Percent error indicates the fraction of samples, which are misclassified. A value of 0
means no misclassifications, 100 indicates maximum misclassifications.
Table 3. Cross-entropy and error results
Process
Numbers of records Length of each record Cross-entropy Error
Training 142
10-s
5.91e
−1
0
Validation 30
10-s
1.94e
0
20
Testing
30
10-s
1.95e
0
26.7
Fig. 11. Best performance results
110
L. Khriji et al.