

3.2.2 Histogram Error
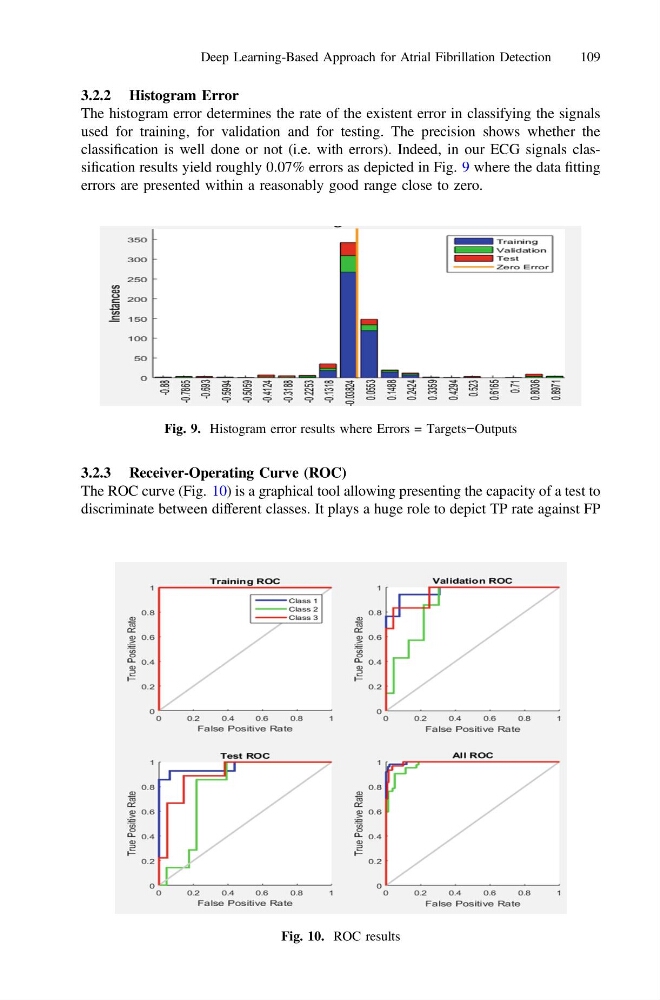
The histogram error determines the rate of the existent error in classifying the signals
used for training, for validation and for testing. The precision shows whether the
classification is well done or not (i.e. with errors). Indeed, in our ECG signals classification results yield roughly 0.07% errors as depicted in Fig. 9 where the data fitting
errors are presented within a reasonably good range close to zero.
3.2.3 Receiver-Operating Curve (ROC)
The ROC curve (Fig. 10) is a graphical tool allowing presenting the capacity of a test to
discriminate between different classes. It plays a huge role to depict TP rate against FP
Fig. 9. Histogram error results where Errors = Targets−Outputs
Fig. 10. ROC results
Deep Learning-Based Approach for Atrial Fibrillation Detection
109
The histogram error determines the rate of the existent error in classifying the signals
used for training, for validation and for testing. The precision shows whether the
classification is well done or not (i.e. with errors). Indeed, in our ECG signals classification results yield roughly 0.07% errors as depicted in Fig. 9 where the data fitting
errors are presented within a reasonably good range close to zero.
3.2.3 Receiver-Operating Curve (ROC)
The ROC curve (Fig. 10) is a graphical tool allowing presenting the capacity of a test to
discriminate between different classes. It plays a huge role to depict TP rate against FP
Fig. 9. Histogram error results where Errors = Targets−Outputs
Fig. 10. ROC results
Deep Learning-Based Approach for Atrial Fibrillation Detection
109