

26
1 The First Few Steps
the legend command. In the plot command above, we first specify the plotting of
f_values and then g_values. In the legend command, t**2 should thus appear
before e**t (as it does).
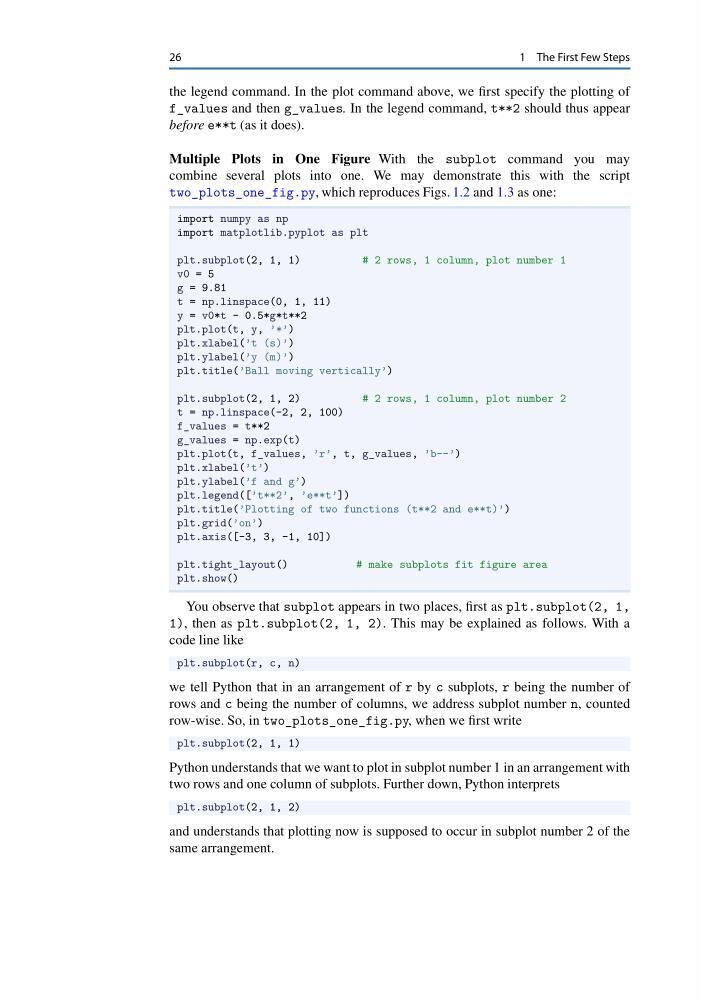
Multiple Plots in One Figure With the subplot command you may
combine several plots into one. We may demonstrate this with the script
two_plots_one_fig.py, which reproduces Figs. 1.2 and 1.3 as one:
import numpy as np
import matplotlib.pyplot as plt
plt.subplot(2, 1, 1)
# 2 rows, 1 column, plot number 1
v0 = 5
g = 9.81
t = np.linspace(0, 1, 11)
y = v0*t - 0.5*g*t**2
plt.plot(t, y, ’*’)
plt.xlabel(’t (s)’)
plt.ylabel(’y (m)’)
plt.title(’Ball moving vertically’)
plt.subplot(2, 1, 2)
# 2 rows, 1 column, plot number 2
t = np.linspace(-2, 2, 100)
f_values = t**2
g_values = np.exp(t)
plt.plot(t, f_values, ’r’, t, g_values, ’b--’)
plt.xlabel(’t’)
plt.ylabel(’f and g’)
plt.legend([’t**2’, ’e**t’])
plt.title(’Plotting of two functions (t**2 and e**t)’)
plt.grid(’on’)
plt.axis([-3, 3, -1, 10])
plt.tight_layout()
# make subplots fit figure area
plt.show()
You observe that subplot appears in two places, first as plt.subplot(2, 1,
1), then as plt.subplot(2, 1, 2). This may be explained as follows. With a
code line like
plt.subplot(r, c, n)
we tell Python that in an arrangement of r by c subplots, r being the number of
rows and c being the number of columns, we address subplot number n, counted
row-wise. So, in two_plots_one_fig.py, when we first write
plt.subplot(2, 1, 1)
Python understands that we want to plot in subplot number 1 in an arrangement with
two rows and one column of subplots. Further down, Python interprets
plt.subplot(2, 1, 2)
and understands that plotting now is supposed to occur in subplot number 2 of the
same arrangement.
1 The First Few Steps
the legend command. In the plot command above, we first specify the plotting of
f_values and then g_values. In the legend command, t**2 should thus appear
before e**t (as it does).
Multiple Plots in One Figure With the subplot command you may
combine several plots into one. We may demonstrate this with the script
two_plots_one_fig.py, which reproduces Figs. 1.2 and 1.3 as one:
import numpy as np
import matplotlib.pyplot as plt
plt.subplot(2, 1, 1)
# 2 rows, 1 column, plot number 1
v0 = 5
g = 9.81
t = np.linspace(0, 1, 11)
y = v0*t - 0.5*g*t**2
plt.plot(t, y, ’*’)
plt.xlabel(’t (s)’)
plt.ylabel(’y (m)’)
plt.title(’Ball moving vertically’)
plt.subplot(2, 1, 2)
# 2 rows, 1 column, plot number 2
t = np.linspace(-2, 2, 100)
f_values = t**2
g_values = np.exp(t)
plt.plot(t, f_values, ’r’, t, g_values, ’b--’)
plt.xlabel(’t’)
plt.ylabel(’f and g’)
plt.legend([’t**2’, ’e**t’])
plt.title(’Plotting of two functions (t**2 and e**t)’)
plt.grid(’on’)
plt.axis([-3, 3, -1, 10])
plt.tight_layout()
# make subplots fit figure area
plt.show()
You observe that subplot appears in two places, first as plt.subplot(2, 1,
1), then as plt.subplot(2, 1, 2). This may be explained as follows. With a
code line like
plt.subplot(r, c, n)
we tell Python that in an arrangement of r by c subplots, r being the number of
rows and c being the number of columns, we address subplot number n, counted
row-wise. So, in two_plots_one_fig.py, when we first write
plt.subplot(2, 1, 1)
Python understands that we want to plot in subplot number 1 in an arrangement with
two rows and one column of subplots. Further down, Python interprets
plt.subplot(2, 1, 2)
and understands that plotting now is supposed to occur in subplot number 2 of the
same arrangement.