

1.6 Plotting, Printing and Input Data
27
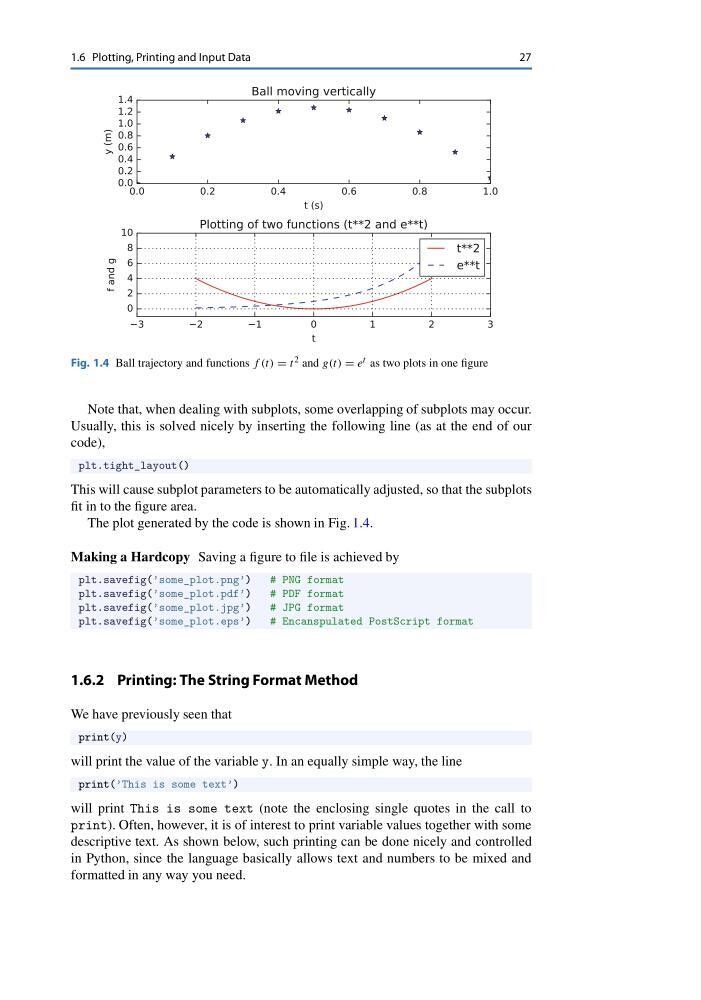
Fig. 1.4 Ball trajectory and functions f (t) = t 2 and g(t) = e t as two plots in one figure
Note that, when dealing with subplots, some overlapping of subplots may occur.
Usually, this is solved nicely by inserting the following line (as at the end of our
code),
plt.tight_layout()
This will cause subplot parameters to be automatically adjusted, so that the subplots
fit in to the figure area.
The plot generated by the code is shown in Fig. 1.4.
Making a Hardcopy Saving a figure to file is achieved by
plt.savefig(’some_plot.png’)
# PNG format
plt.savefig(’some_plot.pdf’)
# PDF format
plt.savefig(’some_plot.jpg’)
# JPG format
plt.savefig(’some_plot.eps’)
# Encanspulated PostScript format
1.6.2 Printing: The String Format Method
We have previously seen that
print(y)
will print the value of the variable y. In an equally simple way, the line
print(’This is some text’)
will print This is some text (note the enclosing single quotes in the call to
print). Often, however, it is of interest to print variable values together with some
descriptive text. As shown below, such printing can be done nicely and controlled
in Python, since the language basically allows text and numbers to be mixed and
formatted in any way you need.
27
Fig. 1.4 Ball trajectory and functions f (t) = t 2 and g(t) = e t as two plots in one figure
Note that, when dealing with subplots, some overlapping of subplots may occur.
Usually, this is solved nicely by inserting the following line (as at the end of our
code),
plt.tight_layout()
This will cause subplot parameters to be automatically adjusted, so that the subplots
fit in to the figure area.
The plot generated by the code is shown in Fig. 1.4.
Making a Hardcopy Saving a figure to file is achieved by
plt.savefig(’some_plot.png’)
# PNG format
plt.savefig(’some_plot.pdf’)
# PDF format
plt.savefig(’some_plot.jpg’)
# JPG format
plt.savefig(’some_plot.eps’)
# Encanspulated PostScript format
1.6.2 Printing: The String Format Method
We have previously seen that
print(y)
will print the value of the variable y. In an equally simple way, the line
print(’This is some text’)
will print This is some text (note the enclosing single quotes in the call to
print). Often, however, it is of interest to print variable values together with some
descriptive text. As shown below, such printing can be done nicely and controlled
in Python, since the language basically allows text and numbers to be mixed and
formatted in any way you need.