

(SSI; Vicente-Serrano et al. 2011). Where possible, also a 10-day forecast for these
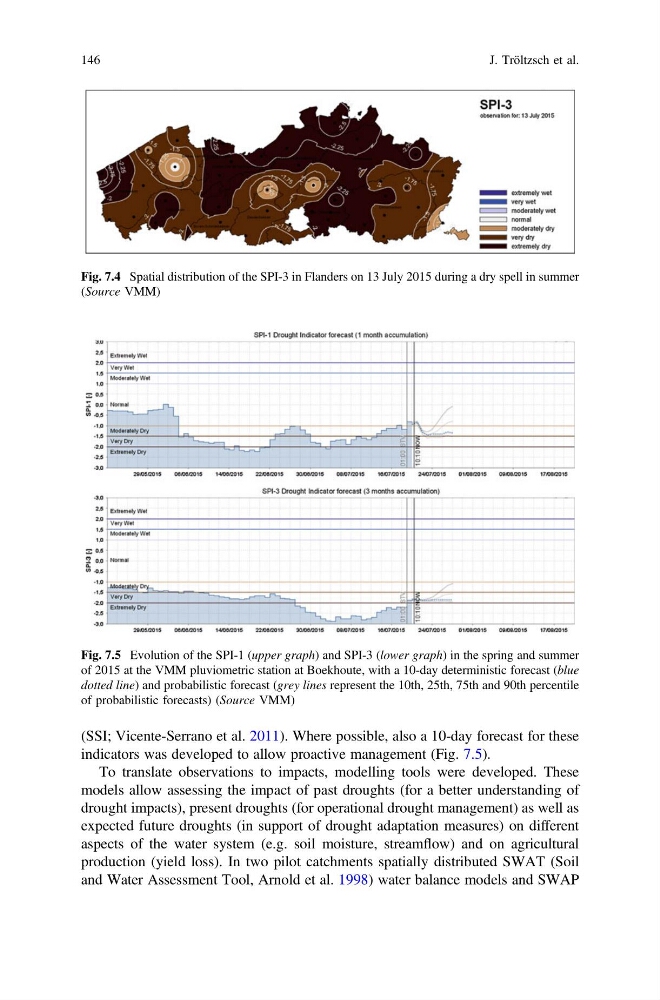
indicators was developed to allow proactive management (Fig. 7.5).
To translate observations to impacts, modelling tools were developed. These
models allow assessing the impact of past droughts (for a better understanding of
drought impacts), present droughts (for operational drought management) as well as
expected future droughts (in support of drought adaptation measures) on different
aspects of the water system (e.g. soil moisture, streamflow) and on agricultural
production (yield loss). In two pilot catchments spatially distributed SWAT (Soil
and Water Assessment Tool, Arnold et al. 1998) water balance models and SWAP
Fig. 7.4 Spatial distribution of the SPI-3 in Flanders on 13 July 2015 during a dry spell in summer
(Source VMM)
Fig. 7.5 Evolution of the SPI-1 (upper graph) and SPI-3 (lower graph) in the spring and summer
of 2015 at the VMM pluviometric station at Boekhoute, with a 10-day deterministic forecast (blue
dotted line) and probabilistic forecast (grey lines represent the 10th, 25th, 75th and 90th percentile
of probabilistic forecasts) (Source VMM)
146
J. Tröltzsch et al.
indicators was developed to allow proactive management (Fig. 7.5).
To translate observations to impacts, modelling tools were developed. These
models allow assessing the impact of past droughts (for a better understanding of
drought impacts), present droughts (for operational drought management) as well as
expected future droughts (in support of drought adaptation measures) on different
aspects of the water system (e.g. soil moisture, streamflow) and on agricultural
production (yield loss). In two pilot catchments spatially distributed SWAT (Soil
and Water Assessment Tool, Arnold et al. 1998) water balance models and SWAP
Fig. 7.4 Spatial distribution of the SPI-3 in Flanders on 13 July 2015 during a dry spell in summer
(Source VMM)
Fig. 7.5 Evolution of the SPI-1 (upper graph) and SPI-3 (lower graph) in the spring and summer
of 2015 at the VMM pluviometric station at Boekhoute, with a 10-day deterministic forecast (blue
dotted line) and probabilistic forecast (grey lines represent the 10th, 25th, 75th and 90th percentile
of probabilistic forecasts) (Source VMM)
146
J. Tröltzsch et al.