

264
(a) “Costs for purchasing water from Mekorot at the municipality gate and costs for
seawater desalination, wastewater treatment and subsidies”.
(b) Costs for water distribution, sewage collection and wastewater treatment within
the municipalities.
For a closer look on the tariff structure, we refer to Kislev ( 2011 ).
Water supply for agriculture is organised by an administrative allotment of quotas. Trading of the quotas among the agricultural companies is permitted under
restricted conditions.
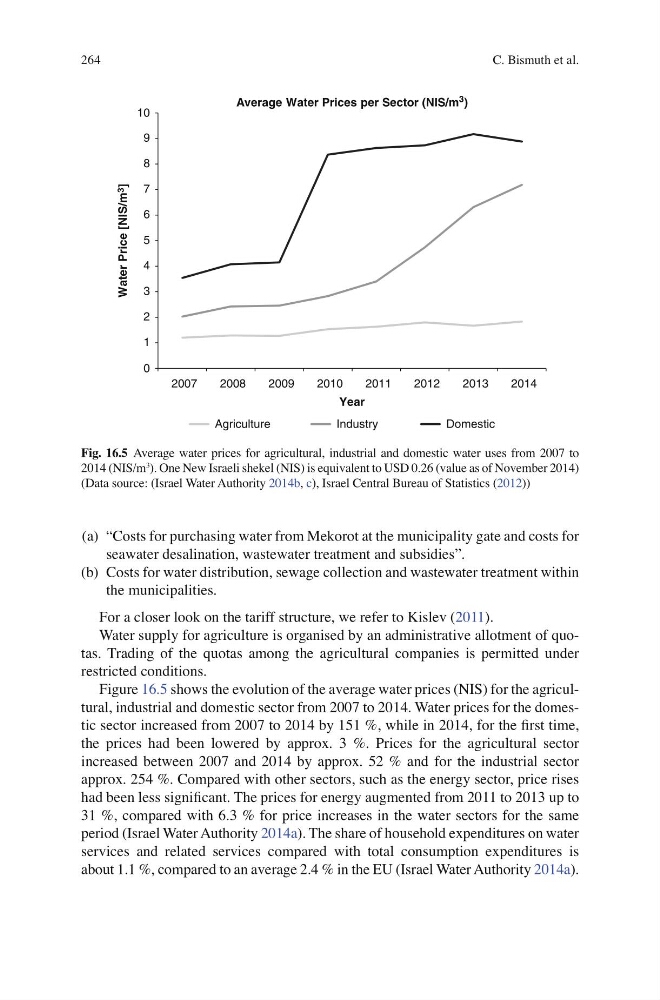
Figure 16.5 shows the evolution of the average water prices (NIS) for the agricultural, industrial and domestic sector from 2007 to 2014. Water prices for the domestic sector increased from 2007 to 2014 by 151 %, while in 2014, for the fi rst time,
the prices had been lowered by approx. 3 %. Prices for the agricultural sector
increased between 2007 and 2014 by approx. 52 % and for the industrial sector
approx. 254 %. Compared with other sectors, such as the energy sector, price rises
had been less signifi cant. The prices for energy augmented from 2011 to 2013 up to
31 %, compared with 6.3 % for price increases in the water sectors for the same
period (Israel Water Authority 2014a ). The share of household expenditures on water
services and related services compared with total consumption expenditures is
about 1.1 %, compared to an average 2.4 % in the EU (Israel Water Authority 2014a ).
0
1
2
3
4
5
6
7
8
9
10
2007
2008
2009
2010
2011
2012
2013
2014
Water Price [NIS/m 3
]
Year
Average Water Prices per Sector (NIS/m 3 )
Agriculture
Industry
Domestic
Fig. 16.5 Average water prices for agricultural, industrial and domestic water uses from 2007 to
2014 (NIS/m
3
). One New Israeli shekel (NIS) is equivalent to USD 0.26 (value as of November 2014)
(Data source: (Israel Water Authority 2014b , c ), Israel Central Bureau of Statistics ( 2012 ))
C. Bismuth et al.
(a) “Costs for purchasing water from Mekorot at the municipality gate and costs for
seawater desalination, wastewater treatment and subsidies”.
(b) Costs for water distribution, sewage collection and wastewater treatment within
the municipalities.
For a closer look on the tariff structure, we refer to Kislev ( 2011 ).
Water supply for agriculture is organised by an administrative allotment of quotas. Trading of the quotas among the agricultural companies is permitted under
restricted conditions.
Figure 16.5 shows the evolution of the average water prices (NIS) for the agricultural, industrial and domestic sector from 2007 to 2014. Water prices for the domestic sector increased from 2007 to 2014 by 151 %, while in 2014, for the fi rst time,
the prices had been lowered by approx. 3 %. Prices for the agricultural sector
increased between 2007 and 2014 by approx. 52 % and for the industrial sector
approx. 254 %. Compared with other sectors, such as the energy sector, price rises
had been less signifi cant. The prices for energy augmented from 2011 to 2013 up to
31 %, compared with 6.3 % for price increases in the water sectors for the same
period (Israel Water Authority 2014a ). The share of household expenditures on water
services and related services compared with total consumption expenditures is
about 1.1 %, compared to an average 2.4 % in the EU (Israel Water Authority 2014a ).
0
1
2
3
4
5
6
7
8
9
10
2007
2008
2009
2010
2011
2012
2013
2014
Water Price [NIS/m 3
]
Year
Average Water Prices per Sector (NIS/m 3 )
Agriculture
Industry
Domestic
Fig. 16.5 Average water prices for agricultural, industrial and domestic water uses from 2007 to
2014 (NIS/m
3
). One New Israeli shekel (NIS) is equivalent to USD 0.26 (value as of November 2014)
(Data source: (Israel Water Authority 2014b , c ), Israel Central Bureau of Statistics ( 2012 ))
C. Bismuth et al.