

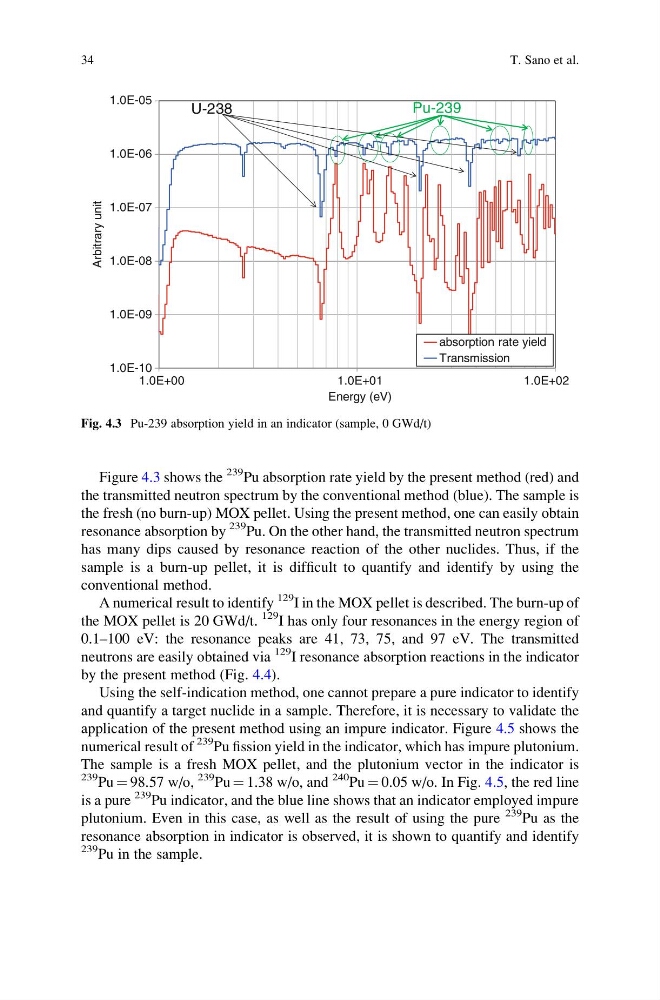
Figure 4.3 shows the
239 Pu absorption rate yield by the present method (red) and
the transmitted neutron spectrum by the conventional method (blue). The sample is
the fresh (no burn-up) MOX pellet. Using the present method, one can easily obtain
resonance absorption by
239 Pu. On the other hand, the transmitted neutron spectrum
has many dips caused by resonance reaction of the other nuclides. Thus, if the
sample is a burn-up pellet, it is difficult to quantify and identify by using the
conventional method.
A numerical result to identify
129 I in the MOX pellet is described. The burn-up of
the MOX pellet is 20 GWd/t.
129 I has only four resonances in the energy region of
0.1–100 eV: the resonance peaks are 41, 73, 75, and 97 eV. The transmitted
neutrons are easily obtained via
129
I resonance absorption reactions in the indicator
by the present method (Fig. 4.4).
Using the self-indication method, one cannot prepare a pure indicator to identify
and quantify a target nuclide in a sample. Therefore, it is necessary to validate the
application of the present method using an impure indicator. Figure 4.5 shows the
numerical result of
239 Pu fission yield in the indicator, which has impure plutonium.
The sample is a fresh MOX pellet, and the plutonium vector in the indicator is
239 Pu ¼ 98.57 w/o,
239 Pu ¼ 1.38 w/o, and
240
Pu ¼ 0.05 w/o. In Fig. 4.5, the red line
is a pure
239 Pu indicator, and the blue line shows that an indicator employed impure
plutonium. Even in this case, as well as the result of using the pure
239 Pu as the
resonance absorption in indicator is observed, it is shown to quantify and identify
239 Pu in the sample.
1.0E-10
1.0E-09
1.0E-08
1.0E-07
1.0E-06
1.0E-05
1.0E+00
1.0E+01
1.0E+02
Arbitrary unit
Energy (eV)
absorption rate yield
Transmission
Pu-239
U-238
Fig. 4.3 Pu-239 absorption yield in an indicator (sample, 0 GWd/t)
34
T. Sano et al.
239 Pu absorption rate yield by the present method (red) and
the transmitted neutron spectrum by the conventional method (blue). The sample is
the fresh (no burn-up) MOX pellet. Using the present method, one can easily obtain
resonance absorption by
239 Pu. On the other hand, the transmitted neutron spectrum
has many dips caused by resonance reaction of the other nuclides. Thus, if the
sample is a burn-up pellet, it is difficult to quantify and identify by using the
conventional method.
A numerical result to identify
129 I in the MOX pellet is described. The burn-up of
the MOX pellet is 20 GWd/t.
129 I has only four resonances in the energy region of
0.1–100 eV: the resonance peaks are 41, 73, 75, and 97 eV. The transmitted
neutrons are easily obtained via
129
I resonance absorption reactions in the indicator
by the present method (Fig. 4.4).
Using the self-indication method, one cannot prepare a pure indicator to identify
and quantify a target nuclide in a sample. Therefore, it is necessary to validate the
application of the present method using an impure indicator. Figure 4.5 shows the
numerical result of
239 Pu fission yield in the indicator, which has impure plutonium.
The sample is a fresh MOX pellet, and the plutonium vector in the indicator is
239 Pu ¼ 98.57 w/o,
239 Pu ¼ 1.38 w/o, and
240
Pu ¼ 0.05 w/o. In Fig. 4.5, the red line
is a pure
239 Pu indicator, and the blue line shows that an indicator employed impure
plutonium. Even in this case, as well as the result of using the pure
239 Pu as the
resonance absorption in indicator is observed, it is shown to quantify and identify
239 Pu in the sample.
1.0E-10
1.0E-09
1.0E-08
1.0E-07
1.0E-06
1.0E-05
1.0E+00
1.0E+01
1.0E+02
Arbitrary unit
Energy (eV)
absorption rate yield
Transmission
Pu-239
U-238
Fig. 4.3 Pu-239 absorption yield in an indicator (sample, 0 GWd/t)
34
T. Sano et al.