

continuous-energy Monte Carlo code developed by the Japan Atomic Energy
Agency.
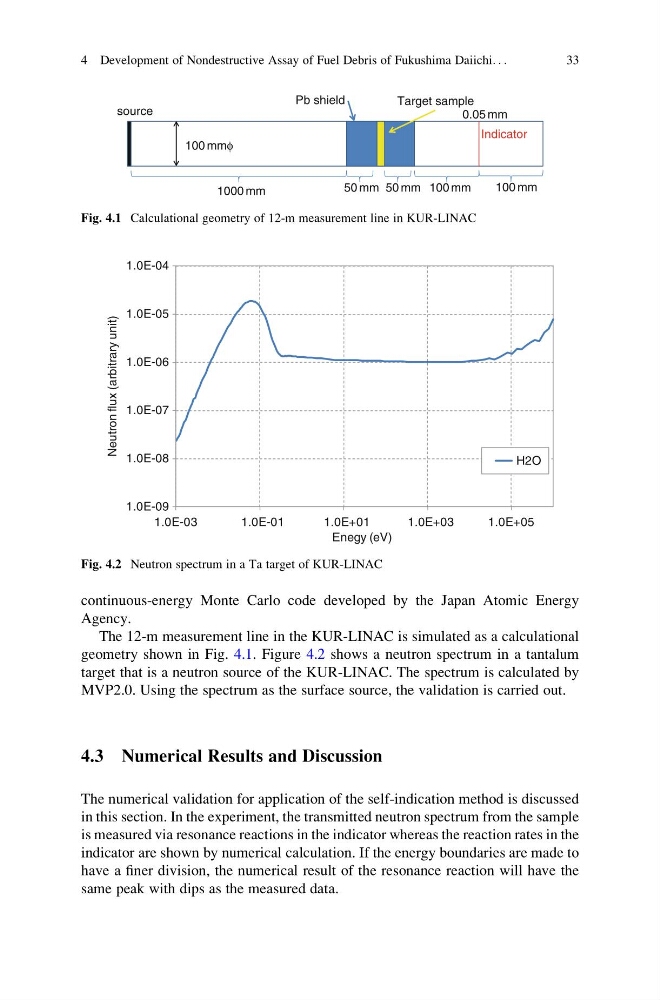
The 12-m measurement line in the KUR-LINAC is simulated as a calculational
geometry shown in Fig. 4.1. Figure 4.2 shows a neutron spectrum in a tantalum
target that is a neutron source of the KUR-LINAC. The spectrum is calculated by
MVP2.0. Using the spectrum as the surface source, the validation is carried out.
4.3 Numerical Results and Discussion
The numerical validation for application of the self-indication method is discussed
in this section. In the experiment, the transmitted neutron spectrum from the sample
is measured via resonance reactions in the indicator whereas the reaction rates in the
indicator are shown by numerical calculation. If the energy boundaries are made to
have a finer division, the numerical result of the resonance reaction will have the
same peak with dips as the measured data.
1000 mm
50 mm 50 mm
0.05 mm
source
Indicator
100 mm
100 mm
100 mmφ
Pb shield
Target sample
Fig. 4.1 Calculational geometry of 12-m measurement line in KUR-LINAC
1.0E-09
1.0E-08
1.0E-07
1.0E-06
1.0E-05
1.0E-04
1.0E-03
1.0E-01
1.0E+01
1.0E+03
1.0E+05
Neutron flux (arbitrary unit)
Enegy (eV)
H2O
Fig. 4.2 Neutron spectrum in a Ta target of KUR-LINAC
4 Development of Nondestructive Assay of Fuel Debris of Fukushima Daiichi. . .
33
Agency.
The 12-m measurement line in the KUR-LINAC is simulated as a calculational
geometry shown in Fig. 4.1. Figure 4.2 shows a neutron spectrum in a tantalum
target that is a neutron source of the KUR-LINAC. The spectrum is calculated by
MVP2.0. Using the spectrum as the surface source, the validation is carried out.
4.3 Numerical Results and Discussion
The numerical validation for application of the self-indication method is discussed
in this section. In the experiment, the transmitted neutron spectrum from the sample
is measured via resonance reactions in the indicator whereas the reaction rates in the
indicator are shown by numerical calculation. If the energy boundaries are made to
have a finer division, the numerical result of the resonance reaction will have the
same peak with dips as the measured data.
1000 mm
50 mm 50 mm
0.05 mm
source
Indicator
100 mm
100 mm
100 mmφ
Pb shield
Target sample
Fig. 4.1 Calculational geometry of 12-m measurement line in KUR-LINAC
1.0E-09
1.0E-08
1.0E-07
1.0E-06
1.0E-05
1.0E-04
1.0E-03
1.0E-01
1.0E+01
1.0E+03
1.0E+05
Neutron flux (arbitrary unit)
Enegy (eV)
H2O
Fig. 4.2 Neutron spectrum in a Ta target of KUR-LINAC
4 Development of Nondestructive Assay of Fuel Debris of Fukushima Daiichi. . .
33