

11.4.3 Bubble-Induced Turbulence
The turbulence intensity measured in this study could be divided into wall turbulence and bubble-induced turbulence. However, turbulent production from bubbles
is dominant at the pipe center. Thus, the turbulence intensity at r/R ¼ 0 was plotted
against the void fraction measured by the four-sensor probe (Fig. 11.6). In addition,
the present results were compared with the previous experimental data of the
bubble-induced turbulence in an air–water two-phase flow system. The solid line
in this figure denotes the calculated value by the following semi-theoretical
equation [5].
u
0
¼ u r α
0:5
:
ð11:2Þ
In this equation, the velocity field around the bubble is assumed as potential flow
and the rotational component of the wake is ignored. In addition, the value
calculated by the empirical equation for air–water two-phase flow [6] is also
drawn as the dashed line in Fig. 11.6; the equation is represented as follows:
u
0
¼ 0:85α
0:8
:
ð11:3Þ
Although the fluid properties are different with the air–water two-phase flow, the
measured turbulence intensity agrees with Eq. (11.3) and the previous data [7–9],
except the result at z/D ¼ 3.2. However, Eq. (11.3) was derived for an air–water
flow system and its applicability to liquid metal flow was not clear. Therefore, the
mechanism of turbulence production in liquid metal two-phase flow should be
investigated in more detail. On the other hand, the turbulence intensity at z/
D ¼ 3.2 was slightly larger than other plots and Eq. (11.3). The measurement
0.0
0.1
0.2
0.3
0.1
1
10
Hibiki et al. (2002)
Hibiki et al. (2001)
Akita and Yoshida (1974)
Serizawa and Kataoka (1988)
Serizawa and Kataoka (1986)
–50%
Void fraction, a [-]
Estimation Error,
[-]
~
~
+50%
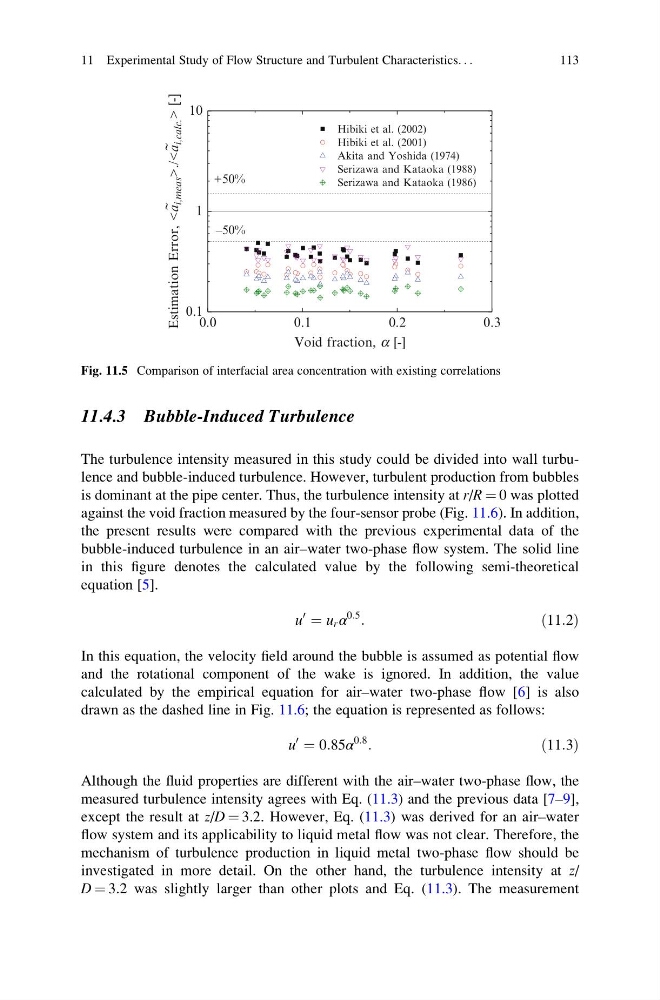
Fig. 11.5 Comparison of interfacial area concentration with existing correlations
11 Experimental Study of Flow Structure and Turbulent Characteristics. . .
113
The turbulence intensity measured in this study could be divided into wall turbulence and bubble-induced turbulence. However, turbulent production from bubbles
is dominant at the pipe center. Thus, the turbulence intensity at r/R ¼ 0 was plotted
against the void fraction measured by the four-sensor probe (Fig. 11.6). In addition,
the present results were compared with the previous experimental data of the
bubble-induced turbulence in an air–water two-phase flow system. The solid line
in this figure denotes the calculated value by the following semi-theoretical
equation [5].
u
0
¼ u r α
0:5
:
ð11:2Þ
In this equation, the velocity field around the bubble is assumed as potential flow
and the rotational component of the wake is ignored. In addition, the value
calculated by the empirical equation for air–water two-phase flow [6] is also
drawn as the dashed line in Fig. 11.6; the equation is represented as follows:
u
0
¼ 0:85α
0:8
:
ð11:3Þ
Although the fluid properties are different with the air–water two-phase flow, the
measured turbulence intensity agrees with Eq. (11.3) and the previous data [7–9],
except the result at z/D ¼ 3.2. However, Eq. (11.3) was derived for an air–water
flow system and its applicability to liquid metal flow was not clear. Therefore, the
mechanism of turbulence production in liquid metal two-phase flow should be
investigated in more detail. On the other hand, the turbulence intensity at z/
D ¼ 3.2 was slightly larger than other plots and Eq. (11.3). The measurement
0.0
0.1
0.2
0.3
0.1
1
10
Hibiki et al. (2002)
Hibiki et al. (2001)
Akita and Yoshida (1974)
Serizawa and Kataoka (1988)
Serizawa and Kataoka (1986)
–50%
Void fraction, a [-]
Estimation Error,
[-]
~
~
+50%
Fig. 11.5 Comparison of interfacial area concentration with existing correlations
11 Experimental Study of Flow Structure and Turbulent Characteristics. . .
113