

11.4.2 Comparison of Interfacial Area Concentration
Interfacial area concentration measured by the four sensor probes was compared
with existing correlations (Fig. 11.5). The vertical axis shows the estimation error
between the measured and calculated interfacial area concentration. All the correlation overestimates the interfacial area concentration by 50–90 %, which might be
caused by the differences in bubble size and shape. Most of the correlations were
formulated with air–water two-phase flow data for a bubbly flow regime. However,
the bubble shape in a liquid metal two-phase flow might be strongly distorted by the
momentum exchange at the gas–liquid interface. Thus, a more appropriate expression of the interfacial area concentration for liquid metal two-phase flow should be
developed based on the experimental database.
a
c
d
b
0.0 0.2 0.4 0.6 0.8 1.0
0.0
0.1
0.2
0.3
0.4
0.5
z/D=3.2
z/D=17.6
z/D=32.4
j g =15.0 cm/s
j f =20.0 cm/s
Void fraction, a
[-]
Radial Position, r/R [-]
j g =15.0 cm/s
j f =20.0 cm/s
0.0
0.2
0.4
0.6
0.8
1.0
1.0
1.0
0
50
100
150
200
250
300
z/D=3.2
z/D=17.6
z/D=32.4
,
n
o
i
t
a
r
t
n
e
s
n
o
c
a
e
r
a
l
a
i
c
a
f
r
e
t
n
I
a
i
[1/m]
Radial position, r/R [-]
j g =15.0 cm/s
j f =20.0 cm/s
Radial Position, r/R [-]
0.0 0.2 0.4 0.6 0.8
0
10
20
30
40
50
60
70
j g =15.0cm/s
j f =20.0 cm/s
Axial Liquid Velocity, u
[cm/s]
z/D=3.2
z/D=17.6
z/D=32.6
Radial Position, r/R [-]
0.0 0.2 0.4 0.6 0.8
0
1
2
3
4
5
6
j g =15.0 cm/s
j f =20.0 cm/s
Turbulence Intensity, u'/U
mean
[-]
z/D=3.2
z/D=17.6
z/D=32.4
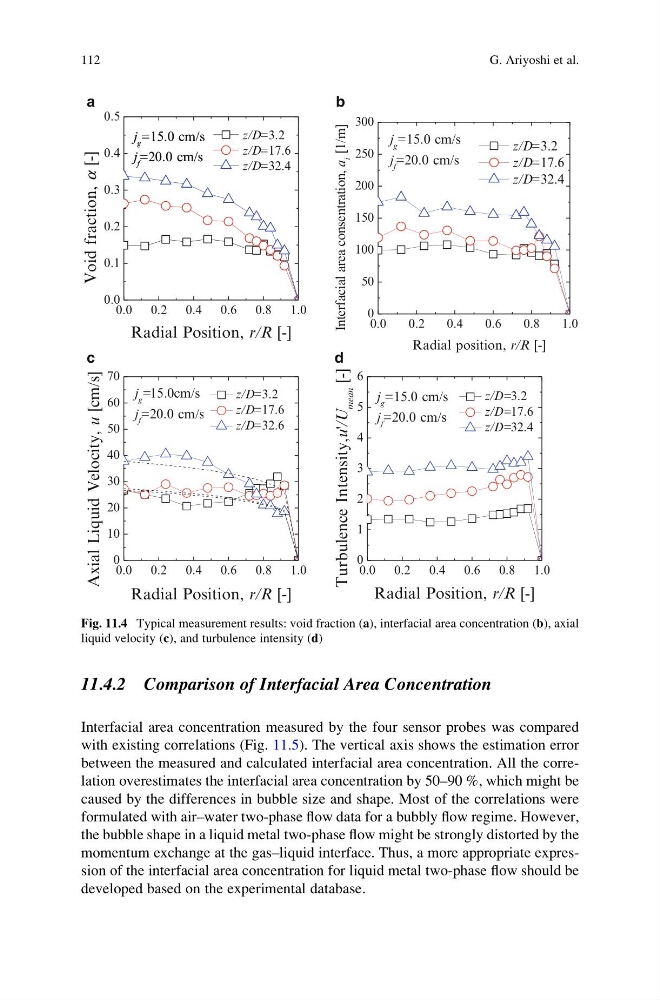
Fig. 11.4 Typical measurement results: void fraction (a), interfacial area concentration (b), axial
liquid velocity (c), and turbulence intensity (d)
112
G. Ariyoshi et al.
Interfacial area concentration measured by the four sensor probes was compared
with existing correlations (Fig. 11.5). The vertical axis shows the estimation error
between the measured and calculated interfacial area concentration. All the correlation overestimates the interfacial area concentration by 50–90 %, which might be
caused by the differences in bubble size and shape. Most of the correlations were
formulated with air–water two-phase flow data for a bubbly flow regime. However,
the bubble shape in a liquid metal two-phase flow might be strongly distorted by the
momentum exchange at the gas–liquid interface. Thus, a more appropriate expression of the interfacial area concentration for liquid metal two-phase flow should be
developed based on the experimental database.
a
c
d
b
0.0 0.2 0.4 0.6 0.8 1.0
0.0
0.1
0.2
0.3
0.4
0.5
z/D=3.2
z/D=17.6
z/D=32.4
j g =15.0 cm/s
j f =20.0 cm/s
Void fraction, a
[-]
Radial Position, r/R [-]
j g =15.0 cm/s
j f =20.0 cm/s
0.0
0.2
0.4
0.6
0.8
1.0
1.0
1.0
0
50
100
150
200
250
300
z/D=3.2
z/D=17.6
z/D=32.4
,
n
o
i
t
a
r
t
n
e
s
n
o
c
a
e
r
a
l
a
i
c
a
f
r
e
t
n
I
a
i
[1/m]
Radial position, r/R [-]
j g =15.0 cm/s
j f =20.0 cm/s
Radial Position, r/R [-]
0.0 0.2 0.4 0.6 0.8
0
10
20
30
40
50
60
70
j g =15.0cm/s
j f =20.0 cm/s
Axial Liquid Velocity, u
[cm/s]
z/D=3.2
z/D=17.6
z/D=32.6
Radial Position, r/R [-]
0.0 0.2 0.4 0.6 0.8
0
1
2
3
4
5
6
j g =15.0 cm/s
j f =20.0 cm/s
Turbulence Intensity, u'/U
mean
[-]
z/D=3.2
z/D=17.6
z/D=32.4
Fig. 11.4 Typical measurement results: void fraction (a), interfacial area concentration (b), axial
liquid velocity (c), and turbulence intensity (d)
112
G. Ariyoshi et al.