

concentration also increases as increasing z/D, as shown in Fig. 11.4b. The axial
liquid velocity profiles are shown in Fig. 11.4c. The dashed lines are the calculated
value of seventh power law, as follows:
U r
ð Þ ¼ U max 1 À
r
R
1=7
ð11:1Þ
where U max is the measured velocity at the pipe center. The measured liquid
velocity profile at z/D ¼ 32.4 has a core peak, although the profiles at z/D ¼ 3.2
and 17.6 have a wall peak. Thus, the liquid velocity profiles were also developed
axially and the gas–liquid interfacial drag force caused by the rising bubbles might
act on the liquid phase. The turbulence intensity profiles in the liquid metal
two-phase flow have a wall peak and they increase with the increase of z/D.
These profiles have a shape similar to that in an air–water two-phase flow. However, the nondimensional turbulence intensity was much larger than the measured
result in air–water flow systems; this might be attributed to the smaller liquid
velocity in the present experimental condition, where the bubble-induced turbulence may be dominant.
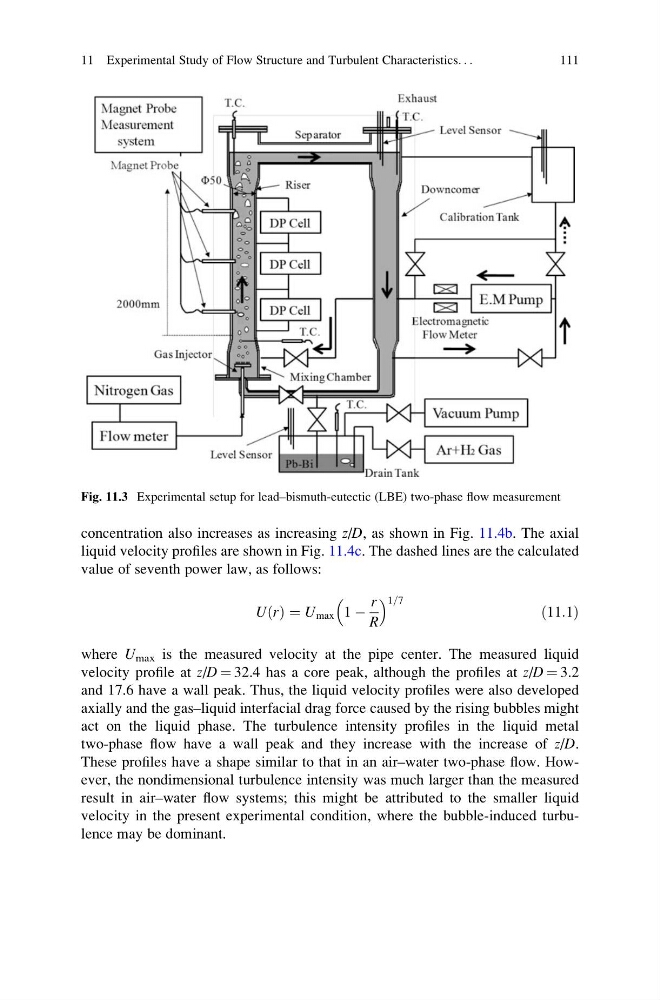
Fig. 11.3 Experimental setup for lead–bismuth-eutectic (LBE) two-phase flow measurement
11 Experimental Study of Flow Structure and Turbulent Characteristics. . .
111
liquid velocity profiles are shown in Fig. 11.4c. The dashed lines are the calculated
value of seventh power law, as follows:
U r
ð Þ ¼ U max 1 À
r
R
1=7
ð11:1Þ
where U max is the measured velocity at the pipe center. The measured liquid
velocity profile at z/D ¼ 32.4 has a core peak, although the profiles at z/D ¼ 3.2
and 17.6 have a wall peak. Thus, the liquid velocity profiles were also developed
axially and the gas–liquid interfacial drag force caused by the rising bubbles might
act on the liquid phase. The turbulence intensity profiles in the liquid metal
two-phase flow have a wall peak and they increase with the increase of z/D.
These profiles have a shape similar to that in an air–water two-phase flow. However, the nondimensional turbulence intensity was much larger than the measured
result in air–water flow systems; this might be attributed to the smaller liquid
velocity in the present experimental condition, where the bubble-induced turbulence may be dominant.
Fig. 11.3 Experimental setup for lead–bismuth-eutectic (LBE) two-phase flow measurement
11 Experimental Study of Flow Structure and Turbulent Characteristics. . .
111