

11.3 Experimental Setup
The schematic diagram of the LBE test loop is illustrated in Fig. 11.3. The test loop
consists of a test section, a gas injector, an electromagnetic pump, a flow meter, and
a drain tank. The test section is a stainless steel pipe with an inner diameter of
50 mm and a length of 2,000 mm. The working fluids are molten LBE and nitrogen
gas. The flow rate of LBE was measured by the magnetic flow meter. Nitrogen gas
was injected into LBE flow by the gas injector, which consists of 101 stainless steel
needle tubes 0.58 mm in inner diameter. The gas flow rate was controlled by a mass
flow controller. The operating temperature of this loop was maintained at 200
C
and the heating power was controlled by a temperature controller unit. The flow
rate, differential pressure, temperature, and liquid level were monitored by a data
acquisition unit connected to a PC. In the experiments, the superficial gas and liquid
velocities were varied. Three four-sensor probes or electromagnetic probes were
installed at three different axial positions (z/D ¼ 3.2, 17.6, and 32.4) of the test
section to investigate the axial development of two-phase flow structure. In addition, these probes were traversed at 12 radial points to obtain the radial profiles.
11.4 Results and Discussion
11.4.1 Radial Profiles of Two-Phase Flow Properties
The radial profiles of void fraction, interfacial area concentration, liquid velocity,
and turbulence intensity are shown in Fig. 11.4. The horizontal axis is the radial
position from the pipe center to the pipe wall, and the vertical axis is the measured
data. The void fraction increases along the flow direction, mainly as a result of the
static pressure change. The void fraction profile at z/D ¼ 3.2 seems to be uniform
and shows a flat shape. As increasing z/D, the void fraction profile changes to core
peak because the large bubble moves to the core region. The interfacial area
Low-noise
Amplifier
LI-75A
Amplifier
AM30AZ
A/D
ADM-688PCI
PC
Control
apparatus
Heater
Motor
Magnet probe
Liquidmetal
Rotating
tank
10
20
30
40
0.0
0
0.5
1.0
1.5
2.0
a
b
Induced Potential, V
[µV]
Liquid velocity, U [cm/s]
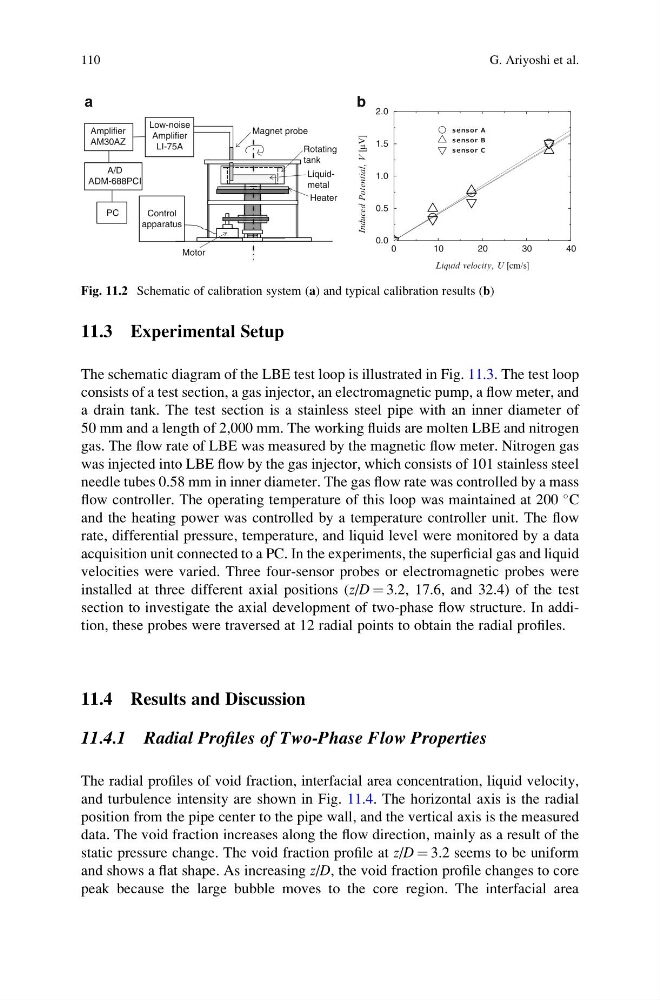
Fig. 11.2 Schematic of calibration system (a) and typical calibration results (b)
110
G. Ariyoshi et al.
The schematic diagram of the LBE test loop is illustrated in Fig. 11.3. The test loop
consists of a test section, a gas injector, an electromagnetic pump, a flow meter, and
a drain tank. The test section is a stainless steel pipe with an inner diameter of
50 mm and a length of 2,000 mm. The working fluids are molten LBE and nitrogen
gas. The flow rate of LBE was measured by the magnetic flow meter. Nitrogen gas
was injected into LBE flow by the gas injector, which consists of 101 stainless steel
needle tubes 0.58 mm in inner diameter. The gas flow rate was controlled by a mass
flow controller. The operating temperature of this loop was maintained at 200
C
and the heating power was controlled by a temperature controller unit. The flow
rate, differential pressure, temperature, and liquid level were monitored by a data
acquisition unit connected to a PC. In the experiments, the superficial gas and liquid
velocities were varied. Three four-sensor probes or electromagnetic probes were
installed at three different axial positions (z/D ¼ 3.2, 17.6, and 32.4) of the test
section to investigate the axial development of two-phase flow structure. In addition, these probes were traversed at 12 radial points to obtain the radial profiles.
11.4 Results and Discussion
11.4.1 Radial Profiles of Two-Phase Flow Properties
The radial profiles of void fraction, interfacial area concentration, liquid velocity,
and turbulence intensity are shown in Fig. 11.4. The horizontal axis is the radial
position from the pipe center to the pipe wall, and the vertical axis is the measured
data. The void fraction increases along the flow direction, mainly as a result of the
static pressure change. The void fraction profile at z/D ¼ 3.2 seems to be uniform
and shows a flat shape. As increasing z/D, the void fraction profile changes to core
peak because the large bubble moves to the core region. The interfacial area
Low-noise
Amplifier
LI-75A
Amplifier
AM30AZ
A/D
ADM-688PCI
PC
Control
apparatus
Heater
Motor
Magnet probe
Liquidmetal
Rotating
tank
10
20
30
40
0.0
0
0.5
1.0
1.5
2.0
a
b
Induced Potential, V
[µV]
Liquid velocity, U [cm/s]
Fig. 11.2 Schematic of calibration system (a) and typical calibration results (b)
110
G. Ariyoshi et al.