

312
reinforced polyester (GFRP) and ductile iron (DI) for 200 mm (Sanjuan- Delmás
et al. 2014 ). The life cycle stages included were the production, transport, and
installation. The operation was excluded because it depends on the specifi c network.
The end of use phase was also omitted since the supply network is left underground
after its use.
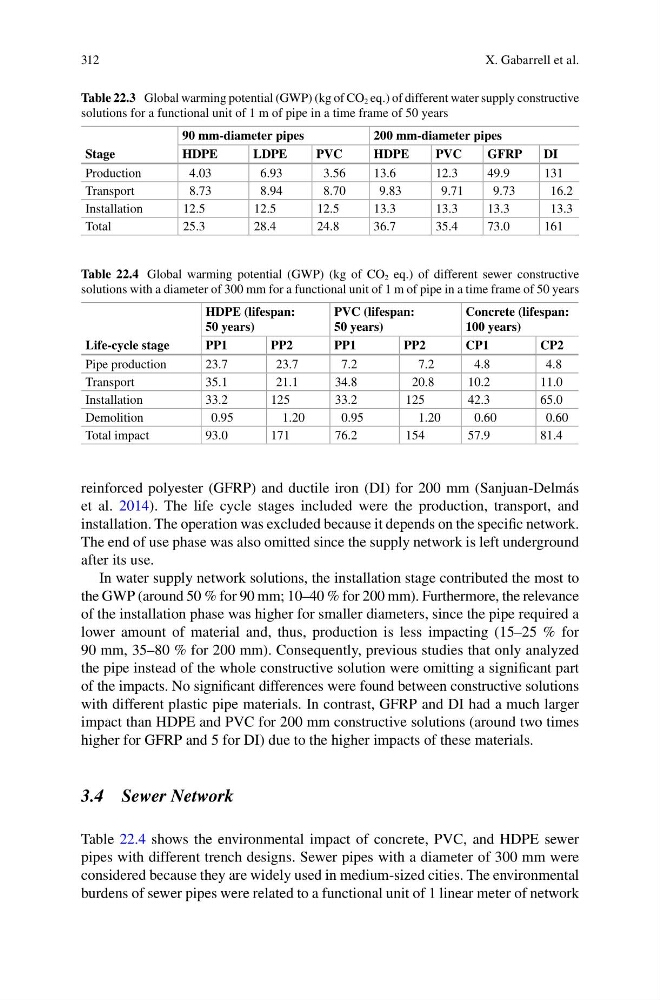
In water supply network solutions, the installation stage contributed the most to
the GWP (around 50 % for 90 mm; 10–40 % for 200 mm). Furthermore, the relevance
of the installation phase was higher for smaller diameters, since the pipe required a
lower amount of material and, thus, production is less impacting (15–25 % for
90 mm, 35–80 % for 200 mm). Consequently, previous studies that only analyzed
the pipe instead of the whole constructive solution were omitting a signifi cant part
of the impacts. No signifi cant differences were found between constructive solutions
with different plastic pipe materials. In contrast, GFRP and DI had a much larger
impact than HDPE and PVC for 200 mm constructive solutions (around two times
higher for GFRP and 5 for DI) due to the higher impacts of these materials.
3.4 Sewer Network
Table 22.4 shows the environmental impact of concrete, PVC, and HDPE sewer
pipes with different trench designs. Sewer pipes with a diameter of 300 mm were
considered because they are widely used in medium-sized cities. The environmental
burdens of sewer pipes were related to a functional unit of 1 linear meter of network
Table 22.3 Global warming potential (GWP) (kg of CO 2 eq.) of different water supply constructive
solutions for a functional unit of 1 m of pipe in a time frame of 50 years
Stage
90 mm-diameter pipes
200 mm-diameter pipes
HDPE
LDPE
PVC
HDPE
PVC
GFRP
DI
Production
4.03
6.93
3.56
13.6
12.3
49.9
131
Transport
8.73
8.94
8.70
9.83
9.71
9.73
16.2
Installation
12.5
12.5
12.5
13.3
13.3
13.3
13.3
Total
25.3
28.4
24.8
36.7
35.4
73.0
161
Table 22.4 Global warming potential (GWP) (kg of CO 2 eq.) of different sewer constructive
solutions with a diameter of 300 mm for a functional unit of 1 m of pipe in a time frame of 50 years
Life-cycle stage
HDPE (lifespan:
50 years)
PVC (lifespan:
50 years)
Concrete (lifespan:
100 years)
PP1
PP2
PP1
PP2
CP1
CP2
Pipe production
23.7
23.7
7.2
7.2
4.8
4.8
Transport
35.1
21.1
34.8
20.8
10.2
11.0
Installation
33.2
125
33.2
125
42.3
65.0
Demolition
0.95
1.20
0.95
1.20
0.60
0.60
Total impact
93.0
171
76.2
154
57.9
81.4
X. Gabarrell et al.
reinforced polyester (GFRP) and ductile iron (DI) for 200 mm (Sanjuan- Delmás
et al. 2014 ). The life cycle stages included were the production, transport, and
installation. The operation was excluded because it depends on the specifi c network.
The end of use phase was also omitted since the supply network is left underground
after its use.
In water supply network solutions, the installation stage contributed the most to
the GWP (around 50 % for 90 mm; 10–40 % for 200 mm). Furthermore, the relevance
of the installation phase was higher for smaller diameters, since the pipe required a
lower amount of material and, thus, production is less impacting (15–25 % for
90 mm, 35–80 % for 200 mm). Consequently, previous studies that only analyzed
the pipe instead of the whole constructive solution were omitting a signifi cant part
of the impacts. No signifi cant differences were found between constructive solutions
with different plastic pipe materials. In contrast, GFRP and DI had a much larger
impact than HDPE and PVC for 200 mm constructive solutions (around two times
higher for GFRP and 5 for DI) due to the higher impacts of these materials.
3.4 Sewer Network
Table 22.4 shows the environmental impact of concrete, PVC, and HDPE sewer
pipes with different trench designs. Sewer pipes with a diameter of 300 mm were
considered because they are widely used in medium-sized cities. The environmental
burdens of sewer pipes were related to a functional unit of 1 linear meter of network
Table 22.3 Global warming potential (GWP) (kg of CO 2 eq.) of different water supply constructive
solutions for a functional unit of 1 m of pipe in a time frame of 50 years
Stage
90 mm-diameter pipes
200 mm-diameter pipes
HDPE
LDPE
PVC
HDPE
PVC
GFRP
DI
Production
4.03
6.93
3.56
13.6
12.3
49.9
131
Transport
8.73
8.94
8.70
9.83
9.71
9.73
16.2
Installation
12.5
12.5
12.5
13.3
13.3
13.3
13.3
Total
25.3
28.4
24.8
36.7
35.4
73.0
161
Table 22.4 Global warming potential (GWP) (kg of CO 2 eq.) of different sewer constructive
solutions with a diameter of 300 mm for a functional unit of 1 m of pipe in a time frame of 50 years
Life-cycle stage
HDPE (lifespan:
50 years)
PVC (lifespan:
50 years)
Concrete (lifespan:
100 years)
PP1
PP2
PP1
PP2
CP1
CP2
Pipe production
23.7
23.7
7.2
7.2
4.8
4.8
Transport
35.1
21.1
34.8
20.8
10.2
11.0
Installation
33.2
125
33.2
125
42.3
65.0
Demolition
0.95
1.20
0.95
1.20
0.60
0.60
Total impact
93.0
171
76.2
154
57.9
81.4
X. Gabarrell et al.