

313
for a timeframe of 50 year, considering the different lifespan of the materials (i.e.,
100 years for concrete and 50 for PVC and HDPE). The sewer operation was
excluded from the assessment, given that the electricity required for pumping wastewater depends on the confi guration of the city.
In terms of GWP, concrete pipes scored better than plastic pipes, mainly because
of their longer durability. The composition of plastic pipes (i.e., oil-based materials)
derived in a larger amount of CO 2 eq. emissions than in the case of concrete (i.e.,
mainly cement). There were also differences related to the trench designs that can
be applied to each pipe material. In a fi rst attempt to compare constructive solutions,
two confi gurations were assigned to each pipe material: sand beddings (PP1),
concrete beddings (PP2 and CP2), and mixed beddings (CP1). PP2 and CP2 resulted
in greater environmental impacts because of the contribution of concrete to the
GWP (>80 %). In general, the installation stage accounted for more than 70 % of
the total life cycle impacts when PP2 and CP2 were applied. At the end, it was determined that concrete pipes with CP1 trenches were the most environmentally friendly
alternative (Petit-Boix et al. 2014 ).
4 Discussion
4.1 Optimizing the Urban Fabric Design
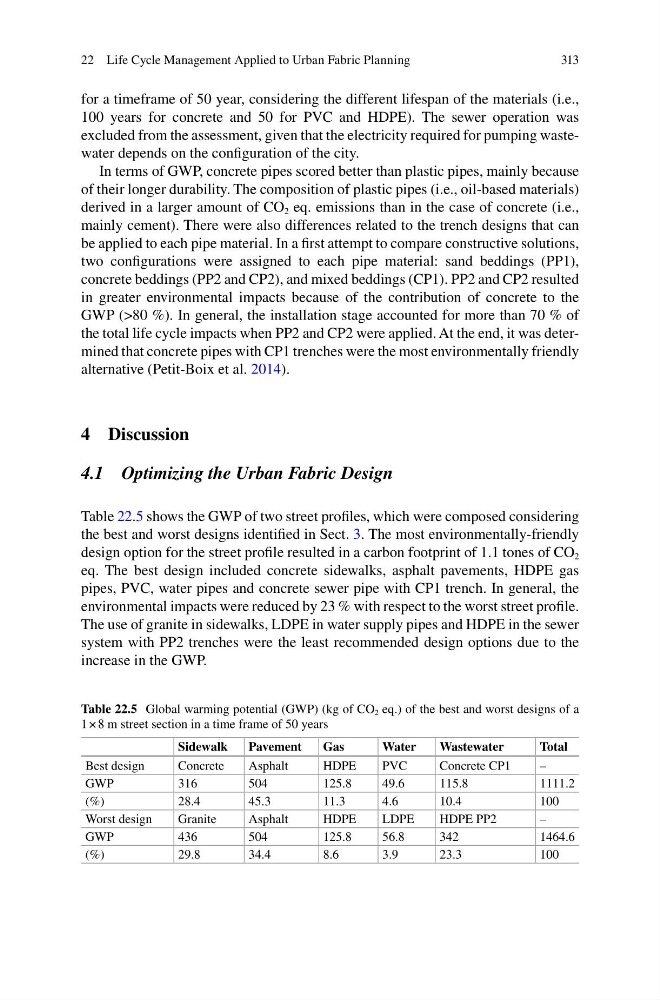
Table 22.5 shows the GWP of two street profi les, which were composed considering
the best and worst designs identifi ed in Sect. 3 . The most environmentally-friendly
design option for the street profi le resulted in a carbon footprint of 1.1 tones of CO 2
eq. The best design included concrete sidewalks, asphalt pavements, HDPE gas
pipes, PVC, water pipes and concrete sewer pipe with CP1 trench. In general, the
environmental impacts were reduced by 23 % with respect to the worst street profi le.
The use of granite in sidewalks, LDPE in water supply pipes and HDPE in the sewer
system with PP2 trenches were the least recommended design options due to the
increase in the GWP.
Table 22.5 Global warming potential (GWP) (kg of CO 2 eq.) of the best and worst designs of a
1 × 8 m street section in a time frame of 50 years
Sidewalk
Pavement
Gas
Water
Wastewater
Total
Best design
Concrete
Asphalt
HDPE
PVC
Concrete CP1
–
GWP
316
504
125.8
49.6
115.8
1111.2
(%)
28.4
45.3
11.3
4.6
10.4
100
Worst design
Granite
Asphalt
HDPE
LDPE
HDPE PP2
–
GWP
436
504
125.8
56.8
342
1464.6
(%)
29.8
34.4
8.6
3.9
23.3
100
22 Life Cycle Management Applied to Urban Fabric Planning
for a timeframe of 50 year, considering the different lifespan of the materials (i.e.,
100 years for concrete and 50 for PVC and HDPE). The sewer operation was
excluded from the assessment, given that the electricity required for pumping wastewater depends on the confi guration of the city.
In terms of GWP, concrete pipes scored better than plastic pipes, mainly because
of their longer durability. The composition of plastic pipes (i.e., oil-based materials)
derived in a larger amount of CO 2 eq. emissions than in the case of concrete (i.e.,
mainly cement). There were also differences related to the trench designs that can
be applied to each pipe material. In a fi rst attempt to compare constructive solutions,
two confi gurations were assigned to each pipe material: sand beddings (PP1),
concrete beddings (PP2 and CP2), and mixed beddings (CP1). PP2 and CP2 resulted
in greater environmental impacts because of the contribution of concrete to the
GWP (>80 %). In general, the installation stage accounted for more than 70 % of
the total life cycle impacts when PP2 and CP2 were applied. At the end, it was determined that concrete pipes with CP1 trenches were the most environmentally friendly
alternative (Petit-Boix et al. 2014 ).
4 Discussion
4.1 Optimizing the Urban Fabric Design
Table 22.5 shows the GWP of two street profi les, which were composed considering
the best and worst designs identifi ed in Sect. 3 . The most environmentally-friendly
design option for the street profi le resulted in a carbon footprint of 1.1 tones of CO 2
eq. The best design included concrete sidewalks, asphalt pavements, HDPE gas
pipes, PVC, water pipes and concrete sewer pipe with CP1 trench. In general, the
environmental impacts were reduced by 23 % with respect to the worst street profi le.
The use of granite in sidewalks, LDPE in water supply pipes and HDPE in the sewer
system with PP2 trenches were the least recommended design options due to the
increase in the GWP.
Table 22.5 Global warming potential (GWP) (kg of CO 2 eq.) of the best and worst designs of a
1 × 8 m street section in a time frame of 50 years
Sidewalk
Pavement
Gas
Water
Wastewater
Total
Best design
Concrete
Asphalt
HDPE
PVC
Concrete CP1
–
GWP
316
504
125.8
49.6
115.8
1111.2
(%)
28.4
45.3
11.3
4.6
10.4
100
Worst design
Granite
Asphalt
HDPE
LDPE
HDPE PP2
–
GWP
436
504
125.8
56.8
342
1464.6
(%)
29.8
34.4
8.6
3.9
23.3
100
22 Life Cycle Management Applied to Urban Fabric Planning