

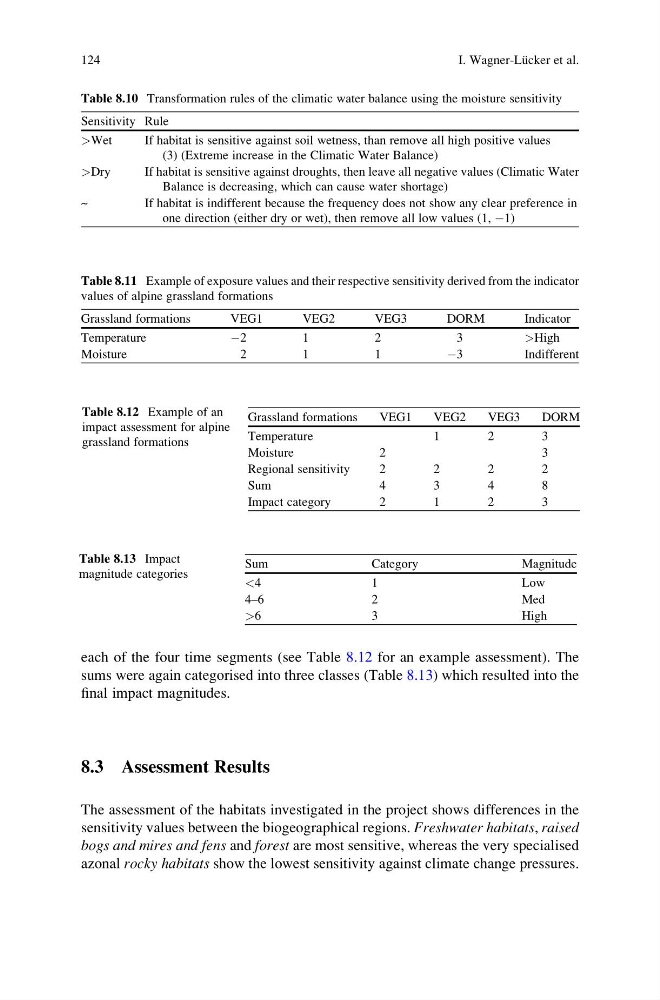
each of the four time segments (see Table 8.12 for an example assessment). The
sums were again categorised into three classes (Table 8.13) which resulted into the
final impact magnitudes.
8.3 Assessment Results
The assessment of the habitats investigated in the project shows differences in the
sensitivity values between the biogeographical regions. Freshwater habitats, raised
bogs and mires and fens and forest are most sensitive, whereas the very specialised
azonal rocky habitats show the lowest sensitivity against climate change pressures.
Table 8.10 Transformation rules of the climatic water balance using the moisture sensitivity
Sensitivity Rule
>Wet
If habitat is sensitive against soil wetness, than remove all high positive values
(3) (Extreme increase in the Climatic Water Balance)
>Dry
If habitat is sensitive against droughts, then leave all negative values (Climatic Water
Balance is decreasing, which can cause water shortage)
~
If habitat is indifferent because the frequency does not show any clear preference in
one direction (either dry or wet), then remove all low values (1, À1)
Table 8.11 Example of exposure values and their respective sensitivity derived from the indicator
values of alpine grassland formations
Grassland formations
VEG1
VEG2
VEG3
DORM
Indicator
Temperature
À2
1
2
3
>High
Moisture
2
1
1
À3
Indifferent
Table 8.12 Example of an
impact assessment for alpine
grassland formations
Grassland formations
VEG1
VEG2
VEG3
DORM
Temperature
1
2
3
Moisture
2
3
Regional sensitivity
2
2
2
2
S u m
4
3
4
8
Impact category
2
1
2
3
Table 8.13 Impact
magnitude categories
Sum
Category
Magnitude
<4
1
Low
4–6
2
Med
>6
3
High
124
I. Wagner-Lu ¨cker et al.
sums were again categorised into three classes (Table 8.13) which resulted into the
final impact magnitudes.
8.3 Assessment Results
The assessment of the habitats investigated in the project shows differences in the
sensitivity values between the biogeographical regions. Freshwater habitats, raised
bogs and mires and fens and forest are most sensitive, whereas the very specialised
azonal rocky habitats show the lowest sensitivity against climate change pressures.
Table 8.10 Transformation rules of the climatic water balance using the moisture sensitivity
Sensitivity Rule
>Wet
If habitat is sensitive against soil wetness, than remove all high positive values
(3) (Extreme increase in the Climatic Water Balance)
>Dry
If habitat is sensitive against droughts, then leave all negative values (Climatic Water
Balance is decreasing, which can cause water shortage)
~
If habitat is indifferent because the frequency does not show any clear preference in
one direction (either dry or wet), then remove all low values (1, À1)
Table 8.11 Example of exposure values and their respective sensitivity derived from the indicator
values of alpine grassland formations
Grassland formations
VEG1
VEG2
VEG3
DORM
Indicator
Temperature
À2
1
2
3
>High
Moisture
2
1
1
À3
Indifferent
Table 8.12 Example of an
impact assessment for alpine
grassland formations
Grassland formations
VEG1
VEG2
VEG3
DORM
Temperature
1
2
3
Moisture
2
3
Regional sensitivity
2
2
2
2
S u m
4
3
4
8
Impact category
2
1
2
3
Table 8.13 Impact
magnitude categories
Sum
Category
Magnitude
<4
1
Low
4–6
2
Med
>6
3
High
124
I. Wagner-Lu ¨cker et al.