

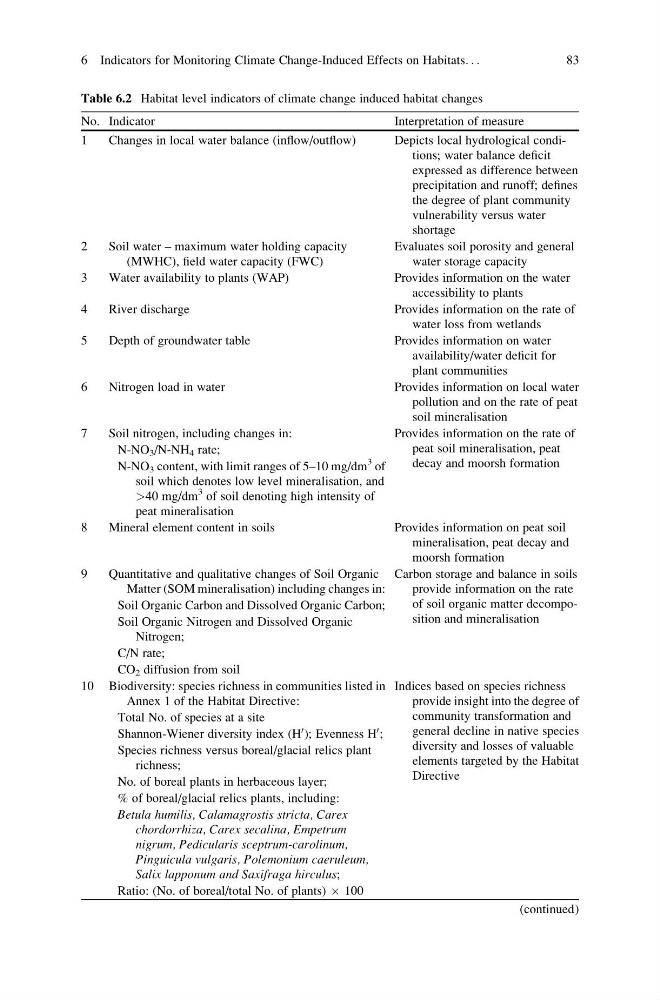
Table 6.2 Habitat level indicators of climate change induced habitat changes
No. Indicator
Interpretation of measure
1
Changes in local water balance (inflow/outflow)
Depicts local hydrological conditions; water balance deficit
expressed as difference between
precipitation and runoff; defines
the degree of plant community
vulnerability versus water
shortage
2
Soil water – maximum water holding capacity
(MWHC), field water capacity (FWC)
Evaluates soil porosity and general
water storage capacity
3
Water availability to plants (WAP)
Provides information on the water
accessibility to plants
4
River discharge
Provides information on the rate of
water loss from wetlands
5
Depth of groundwater table
Provides information on water
availability/water deficit for
plant communities
6
Nitrogen load in water
Provides information on local water
pollution and on the rate of peat
soil mineralisation
7
Soil nitrogen, including changes in:
Provides information on the rate of
peat soil mineralisation, peat
decay and moorsh formation
N-NO 3 /N-NH 4 rate;
N-NO 3 content, with limit ranges of 5–10 mg/dm
3 of
soil which denotes low level mineralisation, and
>40 mg/dm
3 of soil denoting high intensity of
peat mineralisation
8
Mineral element content in soils
Provides information on peat soil
mineralisation, peat decay and
moorsh formation
9
Quantitative and qualitative changes of Soil Organic
Matter (SOM mineralisation) including changes in:
Carbon storage and balance in soils
provide information on the rate
of soil organic matter decomposition and mineralisation
Soil Organic Carbon and Dissolved Organic Carbon;
Soil Organic Nitrogen and Dissolved Organic
Nitrogen;
C/N rate;
CO 2 diffusion from soil
10 Biodiversity: species richness in communities listed in
Annex 1 of the Habitat Directive:
Indices based on species richness
provide insight into the degree of
community transformation and
general decline in native species
diversity and losses of valuable
elements targeted by the Habitat
Directive
Total No. of species at a site
Shannon-Wiener diversity index (H
0 ); Evenness H
0 ;
Species richness versus boreal/glacial relics plant
richness;
No. of boreal plants in herbaceous layer;
% of boreal/glacial relics plants, including:
Betula humilis, Calamagrostis stricta, Carex
chordorrhiza, Carex secalina, Empetrum
nigrum, Pedicularis sceptrum-carolinum,
Pinguicula vulgaris, Polemonium caeruleum,
Salix lapponum and Saxifraga hirculus;
Ratio: (No. of boreal/total No. of plants) Â 100
(continued)
6 Indicators for Monitoring Climate Change-Induced Effects on Habitats. . .
83
No. Indicator
Interpretation of measure
1
Changes in local water balance (inflow/outflow)
Depicts local hydrological conditions; water balance deficit
expressed as difference between
precipitation and runoff; defines
the degree of plant community
vulnerability versus water
shortage
2
Soil water – maximum water holding capacity
(MWHC), field water capacity (FWC)
Evaluates soil porosity and general
water storage capacity
3
Water availability to plants (WAP)
Provides information on the water
accessibility to plants
4
River discharge
Provides information on the rate of
water loss from wetlands
5
Depth of groundwater table
Provides information on water
availability/water deficit for
plant communities
6
Nitrogen load in water
Provides information on local water
pollution and on the rate of peat
soil mineralisation
7
Soil nitrogen, including changes in:
Provides information on the rate of
peat soil mineralisation, peat
decay and moorsh formation
N-NO 3 /N-NH 4 rate;
N-NO 3 content, with limit ranges of 5–10 mg/dm
3 of
soil which denotes low level mineralisation, and
>40 mg/dm
3 of soil denoting high intensity of
peat mineralisation
8
Mineral element content in soils
Provides information on peat soil
mineralisation, peat decay and
moorsh formation
9
Quantitative and qualitative changes of Soil Organic
Matter (SOM mineralisation) including changes in:
Carbon storage and balance in soils
provide information on the rate
of soil organic matter decomposition and mineralisation
Soil Organic Carbon and Dissolved Organic Carbon;
Soil Organic Nitrogen and Dissolved Organic
Nitrogen;
C/N rate;
CO 2 diffusion from soil
10 Biodiversity: species richness in communities listed in
Annex 1 of the Habitat Directive:
Indices based on species richness
provide insight into the degree of
community transformation and
general decline in native species
diversity and losses of valuable
elements targeted by the Habitat
Directive
Total No. of species at a site
Shannon-Wiener diversity index (H
0 ); Evenness H
0 ;
Species richness versus boreal/glacial relics plant
richness;
No. of boreal plants in herbaceous layer;
% of boreal/glacial relics plants, including:
Betula humilis, Calamagrostis stricta, Carex
chordorrhiza, Carex secalina, Empetrum
nigrum, Pedicularis sceptrum-carolinum,
Pinguicula vulgaris, Polemonium caeruleum,
Salix lapponum and Saxifraga hirculus;
Ratio: (No. of boreal/total No. of plants) Â 100
(continued)
6 Indicators for Monitoring Climate Change-Induced Effects on Habitats. . .
83