

village to obtain the majority of loans disbursed by the VBSP program. Due to the
lack of a political voice, the long list of partially effective poverty indicators used
by the MOLISA tool, and due to information failures and the voting process, the
targeting of credit at the poor by the VBSP has actually led to a very unequal
allocation of loans; one favoring non-poor households. Apart from their poor record
in terms of targeting poverty, interest subsidies also threaten the long-term
sustainability of the banking system, undermining the emergence of a microfinance sector which could provide credit and savings services at competitive
market interest rates and on a sustainable basis to poor and non-poor people alike.
Given the weak targeting performance of those current policies using the
MOLISA tool, the question arises as to whether more objective poverty assessment
tools could be used to help improve the targeting performance. The remainder of
this section is devoted to testing alternative poverty assessment tools, those that
attempt to identify practicable and objective indicators of poverty. The data gathered contains many potential poverty indicators, both at the household and individual levels, and covers demographic factors, education, dwelling characteristics and
asset ownership levels. Other facets of poverty were also collected, such as economic opportunities, social and political capital, shocks that households faced
between 2005 and 2009, and access to infrastructure/markets. The criteria used
for the selection of poverty indicators took into account the local definition of
poverty and followed the Simple, Measurable, Adaptable to local conditions,
Robust and Timely (SMART) criteria for the creation and use of proxy poverty
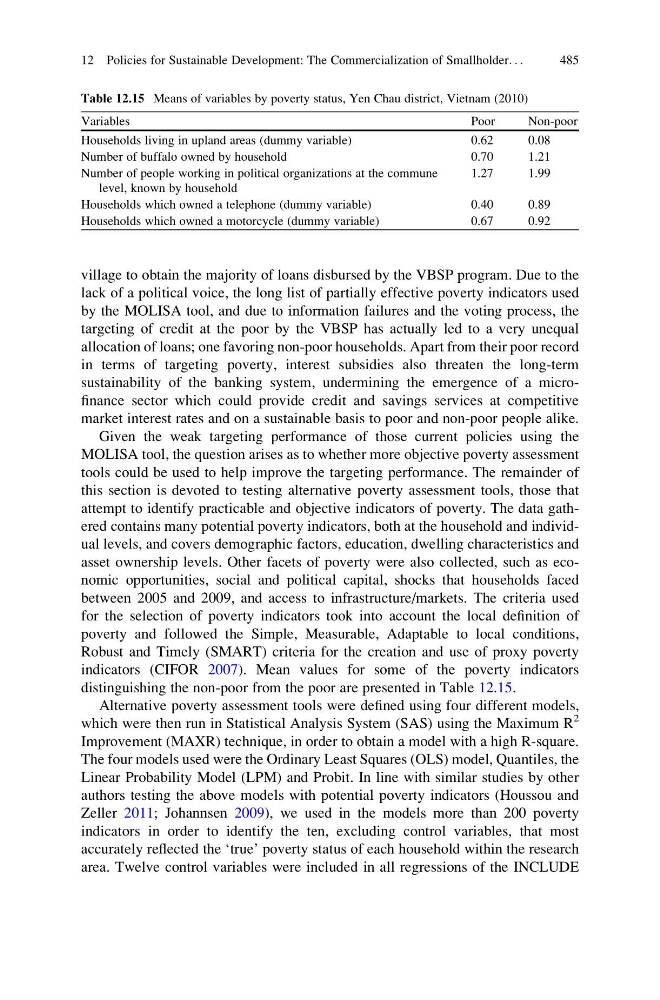
indicators (CIFOR 2007). Mean values for some of the poverty indicators
distinguishing the non-poor from the poor are presented in Table 12.15.
Alternative poverty assessment tools were defined using four different models,
which were then run in Statistical Analysis System (SAS) using the Maximum R
2
Improvement (MAXR) technique, in order to obtain a model with a high R-square.
The four models used were the Ordinary Least Squares (OLS) model, Quantiles, the
Linear Probability Model (LPM) and Probit. In line with similar studies by other
authors testing the above models with potential poverty indicators (Houssou and
Zeller 2011; Johannsen 2009), we used in the models more than 200 poverty
indicators in order to identify the ten, excluding control variables, that most
accurately reflected the ‘true’ poverty status of each household within the research
area. Twelve control variables were included in all regressions of the INCLUDE
Table 12.15 Means of variables by poverty status, Yen Chau district, Vietnam (2010)
Variables
Poor
Non-poor
Households living in upland areas (dummy variable)
0.62
0.08
Number of buffalo owned by household
0.70
1.21
Number of people working in political organizations at the commune
level, known by household
1.27
1.99
Households which owned a telephone (dummy variable)
0.40
0.89
Households which owned a motorcycle (dummy variable)
0.67
0.92
12 Policies for Sustainable Development: The Commercialization of Smallholder. . .
485
lack of a political voice, the long list of partially effective poverty indicators used
by the MOLISA tool, and due to information failures and the voting process, the
targeting of credit at the poor by the VBSP has actually led to a very unequal
allocation of loans; one favoring non-poor households. Apart from their poor record
in terms of targeting poverty, interest subsidies also threaten the long-term
sustainability of the banking system, undermining the emergence of a microfinance sector which could provide credit and savings services at competitive
market interest rates and on a sustainable basis to poor and non-poor people alike.
Given the weak targeting performance of those current policies using the
MOLISA tool, the question arises as to whether more objective poverty assessment
tools could be used to help improve the targeting performance. The remainder of
this section is devoted to testing alternative poverty assessment tools, those that
attempt to identify practicable and objective indicators of poverty. The data gathered contains many potential poverty indicators, both at the household and individual levels, and covers demographic factors, education, dwelling characteristics and
asset ownership levels. Other facets of poverty were also collected, such as economic opportunities, social and political capital, shocks that households faced
between 2005 and 2009, and access to infrastructure/markets. The criteria used
for the selection of poverty indicators took into account the local definition of
poverty and followed the Simple, Measurable, Adaptable to local conditions,
Robust and Timely (SMART) criteria for the creation and use of proxy poverty
indicators (CIFOR 2007). Mean values for some of the poverty indicators
distinguishing the non-poor from the poor are presented in Table 12.15.
Alternative poverty assessment tools were defined using four different models,
which were then run in Statistical Analysis System (SAS) using the Maximum R
2
Improvement (MAXR) technique, in order to obtain a model with a high R-square.
The four models used were the Ordinary Least Squares (OLS) model, Quantiles, the
Linear Probability Model (LPM) and Probit. In line with similar studies by other
authors testing the above models with potential poverty indicators (Houssou and
Zeller 2011; Johannsen 2009), we used in the models more than 200 poverty
indicators in order to identify the ten, excluding control variables, that most
accurately reflected the ‘true’ poverty status of each household within the research
area. Twelve control variables were included in all regressions of the INCLUDE
Table 12.15 Means of variables by poverty status, Yen Chau district, Vietnam (2010)
Variables
Poor
Non-poor
Households living in upland areas (dummy variable)
0.62
0.08
Number of buffalo owned by household
0.70
1.21
Number of people working in political organizations at the commune
level, known by household
1.27
1.99
Households which owned a telephone (dummy variable)
0.40
0.89
Households which owned a motorcycle (dummy variable)
0.67
0.92
12 Policies for Sustainable Development: The Commercialization of Smallholder. . .
485