

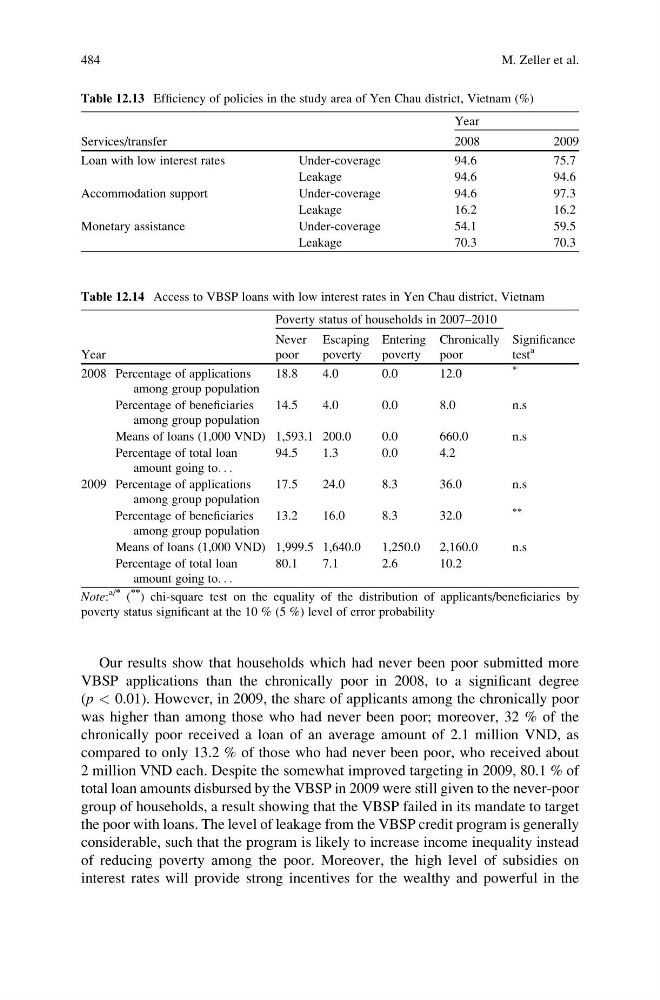
Our results show that households which had never been poor submitted more
VBSP applications than the chronically poor in 2008, to a significant degree
(p < 0.01). However, in 2009, the share of applicants among the chronically poor
was higher than among those who had never been poor; moreover, 32 % of the
chronically poor received a loan of an average amount of 2.1 million VND, as
compared to only 13.2 % of those who had never been poor, who received about
2 million VND each. Despite the somewhat improved targeting in 2009, 80.1 % of
total loan amounts disbursed by the VBSP in 2009 were still given to the never-poor
group of households, a result showing that the VBSP failed in its mandate to target
the poor with loans. The level of leakage from the VBSP credit program is generally
considerable, such that the program is likely to increase income inequality instead
of reducing poverty among the poor. Moreover, the high level of subsidies on
interest rates will provide strong incentives for the wealthy and powerful in the
Table 12.13 Efficiency of policies in the study area of Yen Chau district, Vietnam (%)
Services/transfer
Year
2008
2009
Loan with low interest rates
Under-coverage
94.6
75.7
Leakage
94.6
94.6
Accommodation support
Under-coverage
94.6
97.3
Leakage
16.2
16.2
Monetary assistance
Under-coverage
54.1
59.5
Leakage
70.3
70.3
Table 12.14 Access to VBSP loans with low interest rates in Yen Chau district, Vietnam
Year
Poverty status of households in 2007–2010
Significance
test
a
Never
poor
Escaping
poverty
Entering
poverty
Chronically
poor
2008 Percentage of applications
among group population
18.8
4.0
0.0
12.0
*
Percentage of beneficiaries
among group population
14.5
4.0
0.0
8.0
n.s
Means of loans (1,000 VND) 1,593.1 200.0
0.0
660.0
n.s
Percentage of total loan
amount going to. . .
94.5
1.3
0.0
4.2
2009 Percentage of applications
among group population
17.5
24.0
8.3
36.0
n.s
Percentage of beneficiaries
among group population
13.2
16.0
8.3
32.0
**
Means of loans (1,000 VND) 1,999.5 1,640.0
1,250.0
2,160.0
n.s
Percentage of total loan
amount going to. . .
80.1
7.1
2.6
10.2
Note:
a/* (
**
) chi-square test on the equality of the distribution of applicants/beneficiaries by
poverty status significant at the 10 % (5 %) level of error probability
484
M. Zeller et al.
VBSP applications than the chronically poor in 2008, to a significant degree
(p < 0.01). However, in 2009, the share of applicants among the chronically poor
was higher than among those who had never been poor; moreover, 32 % of the
chronically poor received a loan of an average amount of 2.1 million VND, as
compared to only 13.2 % of those who had never been poor, who received about
2 million VND each. Despite the somewhat improved targeting in 2009, 80.1 % of
total loan amounts disbursed by the VBSP in 2009 were still given to the never-poor
group of households, a result showing that the VBSP failed in its mandate to target
the poor with loans. The level of leakage from the VBSP credit program is generally
considerable, such that the program is likely to increase income inequality instead
of reducing poverty among the poor. Moreover, the high level of subsidies on
interest rates will provide strong incentives for the wealthy and powerful in the
Table 12.13 Efficiency of policies in the study area of Yen Chau district, Vietnam (%)
Services/transfer
Year
2008
2009
Loan with low interest rates
Under-coverage
94.6
75.7
Leakage
94.6
94.6
Accommodation support
Under-coverage
94.6
97.3
Leakage
16.2
16.2
Monetary assistance
Under-coverage
54.1
59.5
Leakage
70.3
70.3
Table 12.14 Access to VBSP loans with low interest rates in Yen Chau district, Vietnam
Year
Poverty status of households in 2007–2010
Significance
test
a
Never
poor
Escaping
poverty
Entering
poverty
Chronically
poor
2008 Percentage of applications
among group population
18.8
4.0
0.0
12.0
*
Percentage of beneficiaries
among group population
14.5
4.0
0.0
8.0
n.s
Means of loans (1,000 VND) 1,593.1 200.0
0.0
660.0
n.s
Percentage of total loan
amount going to. . .
94.5
1.3
0.0
4.2
2009 Percentage of applications
among group population
17.5
24.0
8.3
36.0
n.s
Percentage of beneficiaries
among group population
13.2
16.0
8.3
32.0
**
Means of loans (1,000 VND) 1,999.5 1,640.0
1,250.0
2,160.0
n.s
Percentage of total loan
amount going to. . .
80.1
7.1
2.6
10.2
Note:
a/* (
**
) chi-square test on the equality of the distribution of applicants/beneficiaries by
poverty status significant at the 10 % (5 %) level of error probability
484
M. Zeller et al.