

The chronically poor’s level of access to water for irrigation was qualified as not
good in both years, but, here again, there was a significant difference found between
the chronically poor and the never-poor. This can be explained by the fact that the
chronically poor were mainly from Hmong/other ethnic group households living in
upland villages.
In practice, the local authorities define those who are poor in a very different way
to MOLISA (2007) when using its poverty assessment method (Nguyen and Rama
2007; World Bank 2006). The selection of those considered poor in Yan Chau and
so the beneficiaries of national targeted programs for poverty reduction, was done
through a voting system during the study period. The various panel households
involved in the process of classifying the beneficiaries of government programs
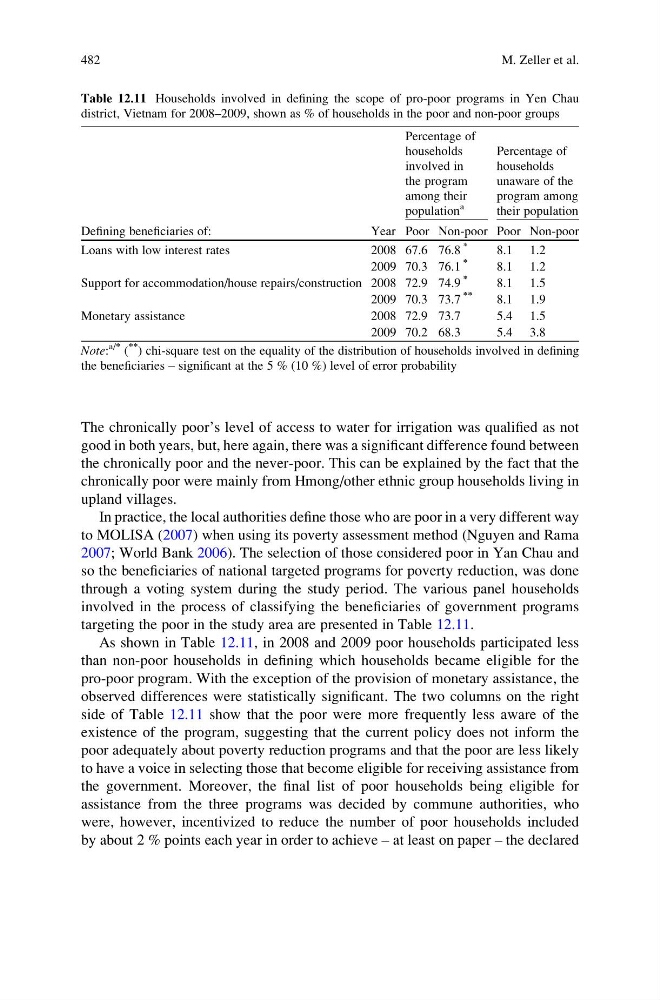
targeting the poor in the study area are presented in Table 12.11.
As shown in Table 12.11, in 2008 and 2009 poor households participated less
than non-poor households in defining which households became eligible for the
pro-poor program. With the exception of the provision of monetary assistance, the
observed differences were statistically significant. The two columns on the right
side of Table 12.11 show that the poor were more frequently less aware of the
existence of the program, suggesting that the current policy does not inform the
poor adequately about poverty reduction programs and that the poor are less likely
to have a voice in selecting those that become eligible for receiving assistance from
the government. Moreover, the final list of poor households being eligible for
assistance from the three programs was decided by commune authorities, who
were, however, incentivized to reduce the number of poor households included
by about 2 % points each year in order to achieve – at least on paper – the declared
Table 12.11 Households involved in defining the scope of pro-poor programs in Yen Chau
district, Vietnam for 2008–2009, shown as % of households in the poor and non-poor groups
Defining beneficiaries of:
Year
Percentage of
households
involved in
the program
among their
population
a
Percentage of
households
unaware of the
program among
their population
Poor Non-poor Poor Non-poor
Loans with low interest rates
2008 67.6 76.8
*
8.1 1.2
2009 70.3 76.1
*
8.1 1.2
Support for accommodation/house repairs/construction 2008 72.9 74.9
*
8.1 1.5
2009 70.3 73.7
**
8.1 1.9
Monetary assistance
2008 72.9 73.7
5.4 1.5
2009 70.2 68.3
5.4 3.8
Note:
a/* (
**
) chi-square test on the equality of the distribution of households involved in defining
the beneficiaries – significant at the 5 % (10 %) level of error probability
482
M. Zeller et al.
good in both years, but, here again, there was a significant difference found between
the chronically poor and the never-poor. This can be explained by the fact that the
chronically poor were mainly from Hmong/other ethnic group households living in
upland villages.
In practice, the local authorities define those who are poor in a very different way
to MOLISA (2007) when using its poverty assessment method (Nguyen and Rama
2007; World Bank 2006). The selection of those considered poor in Yan Chau and
so the beneficiaries of national targeted programs for poverty reduction, was done
through a voting system during the study period. The various panel households
involved in the process of classifying the beneficiaries of government programs
targeting the poor in the study area are presented in Table 12.11.
As shown in Table 12.11, in 2008 and 2009 poor households participated less
than non-poor households in defining which households became eligible for the
pro-poor program. With the exception of the provision of monetary assistance, the
observed differences were statistically significant. The two columns on the right
side of Table 12.11 show that the poor were more frequently less aware of the
existence of the program, suggesting that the current policy does not inform the
poor adequately about poverty reduction programs and that the poor are less likely
to have a voice in selecting those that become eligible for receiving assistance from
the government. Moreover, the final list of poor households being eligible for
assistance from the three programs was decided by commune authorities, who
were, however, incentivized to reduce the number of poor households included
by about 2 % points each year in order to achieve – at least on paper – the declared
Table 12.11 Households involved in defining the scope of pro-poor programs in Yen Chau
district, Vietnam for 2008–2009, shown as % of households in the poor and non-poor groups
Defining beneficiaries of:
Year
Percentage of
households
involved in
the program
among their
population
a
Percentage of
households
unaware of the
program among
their population
Poor Non-poor Poor Non-poor
Loans with low interest rates
2008 67.6 76.8
*
8.1 1.2
2009 70.3 76.1
*
8.1 1.2
Support for accommodation/house repairs/construction 2008 72.9 74.9
*
8.1 1.5
2009 70.3 73.7
**
8.1 1.9
Monetary assistance
2008 72.9 73.7
5.4 1.5
2009 70.2 68.3
5.4 3.8
Note:
a/* (
**
) chi-square test on the equality of the distribution of households involved in defining
the beneficiaries – significant at the 5 % (10 %) level of error probability
482
M. Zeller et al.