

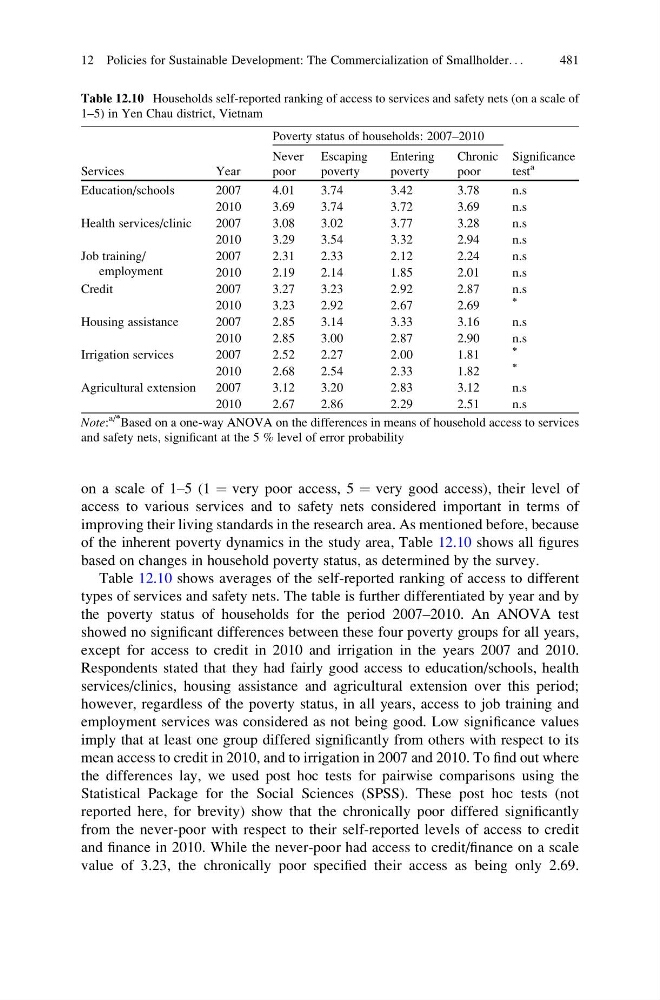
on a scale of 1–5 (1 ¼ very poor access, 5 ¼ very good access), their level of
access to various services and to safety nets considered important in terms of
improving their living standards in the research area. As mentioned before, because
of the inherent poverty dynamics in the study area, Table 12.10 shows all figures
based on changes in household poverty status, as determined by the survey.
Table 12.10 shows averages of the self-reported ranking of access to different
types of services and safety nets. The table is further differentiated by year and by
the poverty status of households for the period 2007–2010. An ANOVA test
showed no significant differences between these four poverty groups for all years,
except for access to credit in 2010 and irrigation in the years 2007 and 2010.
Respondents stated that they had fairly good access to education/schools, health
services/clinics, housing assistance and agricultural extension over this period;
however, regardless of the poverty status, in all years, access to job training and
employment services was considered as not being good. Low significance values
imply that at least one group differed significantly from others with respect to its
mean access to credit in 2010, and to irrigation in 2007 and 2010. To find out where
the differences lay, we used post hoc tests for pairwise comparisons using the
Statistical Package for the Social Sciences (SPSS). These post hoc tests (not
reported here, for brevity) show that the chronically poor differed significantly
from the never-poor with respect to their self-reported levels of access to credit
and finance in 2010. While the never-poor had access to credit/finance on a scale
value of 3.23, the chronically poor specified their access as being only 2.69.
Table 12.10 Households self-reported ranking of access to services and safety nets (on a scale of
1–5) in Yen Chau district, Vietnam
Services
Year
Poverty status of households: 2007–2010
Significance
test
a
Never
poor
Escaping
poverty
Entering
poverty
Chronic
poor
Education/schools
2007
4.01
3.74
3.42
3.78
n.s
2010
3.69
3.74
3.72
3.69
n.s
Health services/clinic
2007
3.08
3.02
3.77
3.28
n.s
2010
3.29
3.54
3.32
2.94
n.s
Job training/
employment
2007
2.31
2.33
2.12
2.24
n.s
2010
2.19
2.14
1.85
2.01
n.s
Credit
2007
3.27
3.23
2.92
2.87
n.s
2010
3.23
2.92
2.67
2.69
*
Housing assistance
2007
2.85
3.14
3.33
3.16
n.s
2010
2.85
3.00
2.87
2.90
n.s
Irrigation services
2007
2.52
2.27
2.00
1.81
*
2010
2.68
2.54
2.33
1.82
*
Agricultural extension
2007
3.12
3.20
2.83
3.12
n.s
2010
2.67
2.86
2.29
2.51
n.s
Note:
a/*
Based on a one-way ANOVA on the differences in means of household access to services
and safety nets, significant at the 5 % level of error probability
12 Policies for Sustainable Development: The Commercialization of Smallholder. . .
481
access to various services and to safety nets considered important in terms of
improving their living standards in the research area. As mentioned before, because
of the inherent poverty dynamics in the study area, Table 12.10 shows all figures
based on changes in household poverty status, as determined by the survey.
Table 12.10 shows averages of the self-reported ranking of access to different
types of services and safety nets. The table is further differentiated by year and by
the poverty status of households for the period 2007–2010. An ANOVA test
showed no significant differences between these four poverty groups for all years,
except for access to credit in 2010 and irrigation in the years 2007 and 2010.
Respondents stated that they had fairly good access to education/schools, health
services/clinics, housing assistance and agricultural extension over this period;
however, regardless of the poverty status, in all years, access to job training and
employment services was considered as not being good. Low significance values
imply that at least one group differed significantly from others with respect to its
mean access to credit in 2010, and to irrigation in 2007 and 2010. To find out where
the differences lay, we used post hoc tests for pairwise comparisons using the
Statistical Package for the Social Sciences (SPSS). These post hoc tests (not
reported here, for brevity) show that the chronically poor differed significantly
from the never-poor with respect to their self-reported levels of access to credit
and finance in 2010. While the never-poor had access to credit/finance on a scale
value of 3.23, the chronically poor specified their access as being only 2.69.
Table 12.10 Households self-reported ranking of access to services and safety nets (on a scale of
1–5) in Yen Chau district, Vietnam
Services
Year
Poverty status of households: 2007–2010
Significance
test
a
Never
poor
Escaping
poverty
Entering
poverty
Chronic
poor
Education/schools
2007
4.01
3.74
3.42
3.78
n.s
2010
3.69
3.74
3.72
3.69
n.s
Health services/clinic
2007
3.08
3.02
3.77
3.28
n.s
2010
3.29
3.54
3.32
2.94
n.s
Job training/
employment
2007
2.31
2.33
2.12
2.24
n.s
2010
2.19
2.14
1.85
2.01
n.s
Credit
2007
3.27
3.23
2.92
2.87
n.s
2010
3.23
2.92
2.67
2.69
*
Housing assistance
2007
2.85
3.14
3.33
3.16
n.s
2010
2.85
3.00
2.87
2.90
n.s
Irrigation services
2007
2.52
2.27
2.00
1.81
*
2010
2.68
2.54
2.33
1.82
*
Agricultural extension
2007
3.12
3.20
2.83
3.12
n.s
2010
2.67
2.86
2.29
2.51
n.s
Note:
a/*
Based on a one-way ANOVA on the differences in means of household access to services
and safety nets, significant at the 5 % level of error probability
12 Policies for Sustainable Development: The Commercialization of Smallholder. . .
481