

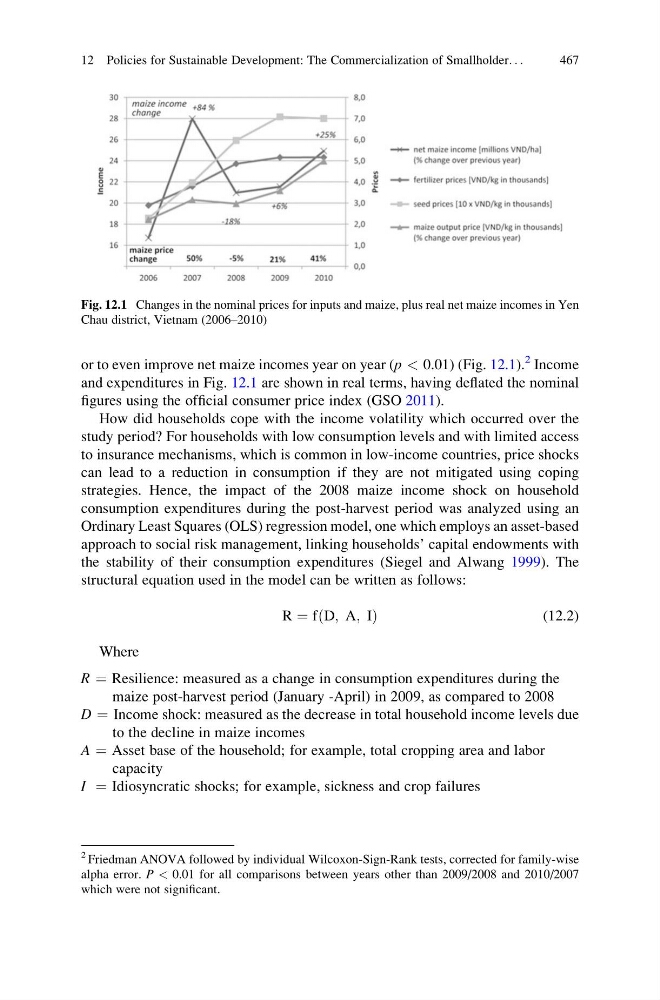
or to even improve net maize incomes year on year (p < 0.01) (Fig. 12.1).
2 Income
and expenditures in Fig. 12.1 are shown in real terms, having deflated the nominal
figures using the official consumer price index (GSO 2011).
How did households cope with the income volatility which occurred over the
study period? For households with low consumption levels and with limited access
to insurance mechanisms, which is common in low-income countries, price shocks
can lead to a reduction in consumption if they are not mitigated using coping
strategies. Hence, the impact of the 2008 maize income shock on household
consumption expenditures during the post-harvest period was analyzed using an
Ordinary Least Squares (OLS) regression model, one which employs an asset-based
approach to social risk management, linking households’ capital endowments with
the stability of their consumption expenditures (Siegel and Alwang 1999). The
structural equation used in the model can be written as follows:
R ¼ fðD; A; IÞ
(12.2)
Where
R ¼ Resilience: measured as a change in consumption expenditures during the
maize post-harvest period (January -April) in 2009, as compared to 2008
D ¼ Income shock: measured as the decrease in total household income levels due
to the decline in maize incomes
A ¼ Asset base of the household; for example, total cropping area and labor
capacity
I ¼ Idiosyncratic shocks; for example, sickness and crop failures
Fig. 12.1 Changes in the nominal prices for inputs and maize, plus real net maize incomes in Yen
Chau district, Vietnam (2006–2010)
2 Friedman ANOVA followed by individual Wilcoxon-Sign-Rank tests, corrected for family-wise
alpha error. P < 0.01 for all comparisons between years other than 2009/2008 and 2010/2007
which were not significant.
12 Policies for Sustainable Development: The Commercialization of Smallholder. . .
467
2 Income
and expenditures in Fig. 12.1 are shown in real terms, having deflated the nominal
figures using the official consumer price index (GSO 2011).
How did households cope with the income volatility which occurred over the
study period? For households with low consumption levels and with limited access
to insurance mechanisms, which is common in low-income countries, price shocks
can lead to a reduction in consumption if they are not mitigated using coping
strategies. Hence, the impact of the 2008 maize income shock on household
consumption expenditures during the post-harvest period was analyzed using an
Ordinary Least Squares (OLS) regression model, one which employs an asset-based
approach to social risk management, linking households’ capital endowments with
the stability of their consumption expenditures (Siegel and Alwang 1999). The
structural equation used in the model can be written as follows:
R ¼ fðD; A; IÞ
(12.2)
Where
R ¼ Resilience: measured as a change in consumption expenditures during the
maize post-harvest period (January -April) in 2009, as compared to 2008
D ¼ Income shock: measured as the decrease in total household income levels due
to the decline in maize incomes
A ¼ Asset base of the household; for example, total cropping area and labor
capacity
I ¼ Idiosyncratic shocks; for example, sickness and crop failures
Fig. 12.1 Changes in the nominal prices for inputs and maize, plus real net maize incomes in Yen
Chau district, Vietnam (2006–2010)
2 Friedman ANOVA followed by individual Wilcoxon-Sign-Rank tests, corrected for family-wise
alpha error. P < 0.01 for all comparisons between years other than 2009/2008 and 2010/2007
which were not significant.
12 Policies for Sustainable Development: The Commercialization of Smallholder. . .
467