

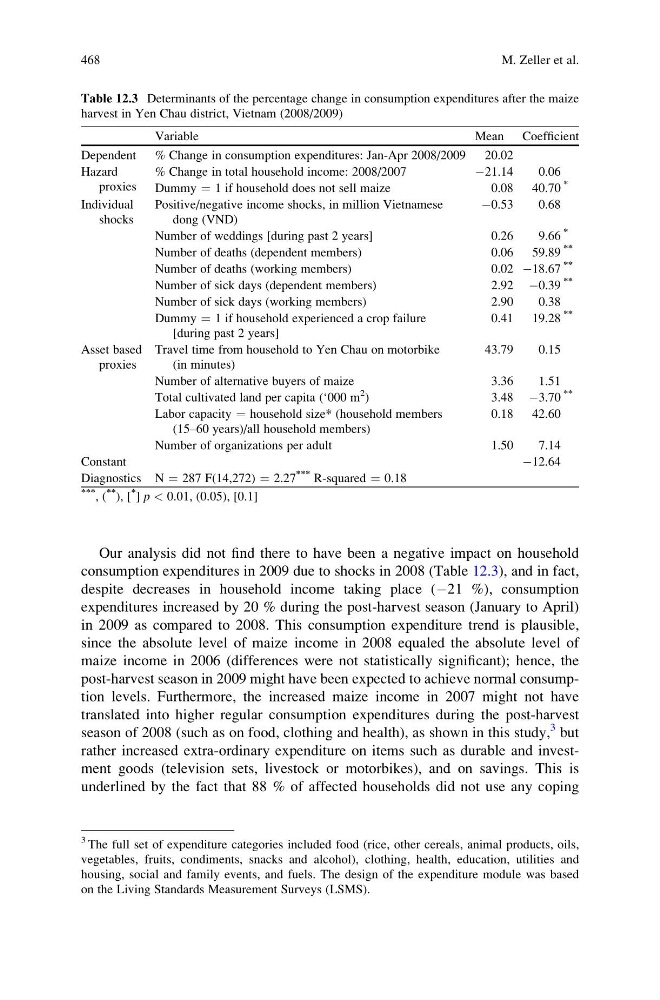
Our analysis did not find there to have been a negative impact on household
consumption expenditures in 2009 due to shocks in 2008 (Table 12.3), and in fact,
despite decreases in household income taking place (À21 %), consumption
expenditures increased by 20 % during the post-harvest season (January to April)
in 2009 as compared to 2008. This consumption expenditure trend is plausible,
since the absolute level of maize income in 2008 equaled the absolute level of
maize income in 2006 (differences were not statistically significant); hence, the
post-harvest season in 2009 might have been expected to achieve normal consumption levels. Furthermore, the increased maize income in 2007 might not have
translated into higher regular consumption expenditures during the post-harvest
season of 2008 (such as on food, clothing and health), as shown in this study,
3 but
rather increased extra-ordinary expenditure on items such as durable and investment goods (television sets, livestock or motorbikes), and on savings. This is
underlined by the fact that 88 % of affected households did not use any coping
Table 12.3 Determinants of the percentage change in consumption expenditures after the maize
harvest in Yen Chau district, Vietnam (2008/2009)
Variable
Mean Coefficient
Dependent % Change in consumption expenditures: Jan-Apr 2008/2009 20.02
Hazard
proxies
% Change in total household income: 2008/2007
À21.14
0.06
Dummy ¼ 1 if household does not sell maize
0.08 40.70
*
Individual
shocks
Positive/negative income shocks, in million Vietnamese
dong (VND)
À0.53
0.68
Number of weddings [during past 2 years]
0.26
9.66
*
Number of deaths (dependent members)
0.06 59.89
**
Number of deaths (working members)
0.02 À18.67
**
Number of sick days (dependent members)
2.92 À0.39
**
Number of sick days (working members)
2.90
0.38
Dummy ¼ 1 if household experienced a crop failure
[during past 2 years]
0.41 19.28
**
Asset based
proxies
Travel time from household to Yen Chau on motorbike
(in minutes)
43.79
0.15
Number of alternative buyers of maize
3.36
1.51
Total cultivated land per capita (‘000 m
2
)
3.48 À3.70
**
Labor capacity ¼ household size* (household members
(15–60 years)/all household members)
0.18 42.60
Number of organizations per adult
1.50
7.14
Constant
À12.64
Diagnostics N ¼ 287 F(14,272) ¼ 2.27
*** R-squared ¼ 0.18
***
, (
**
), [
*
] p < 0.01, (0.05), [0.1]
3 The full set of expenditure categories included food (rice, other cereals, animal products, oils,
vegetables, fruits, condiments, snacks and alcohol), clothing, health, education, utilities and
housing, social and family events, and fuels. The design of the expenditure module was based
on the Living Standards Measurement Surveys (LSMS).
468
M. Zeller et al.
consumption expenditures in 2009 due to shocks in 2008 (Table 12.3), and in fact,
despite decreases in household income taking place (À21 %), consumption
expenditures increased by 20 % during the post-harvest season (January to April)
in 2009 as compared to 2008. This consumption expenditure trend is plausible,
since the absolute level of maize income in 2008 equaled the absolute level of
maize income in 2006 (differences were not statistically significant); hence, the
post-harvest season in 2009 might have been expected to achieve normal consumption levels. Furthermore, the increased maize income in 2007 might not have
translated into higher regular consumption expenditures during the post-harvest
season of 2008 (such as on food, clothing and health), as shown in this study,
3 but
rather increased extra-ordinary expenditure on items such as durable and investment goods (television sets, livestock or motorbikes), and on savings. This is
underlined by the fact that 88 % of affected households did not use any coping
Table 12.3 Determinants of the percentage change in consumption expenditures after the maize
harvest in Yen Chau district, Vietnam (2008/2009)
Variable
Mean Coefficient
Dependent % Change in consumption expenditures: Jan-Apr 2008/2009 20.02
Hazard
proxies
% Change in total household income: 2008/2007
À21.14
0.06
Dummy ¼ 1 if household does not sell maize
0.08 40.70
*
Individual
shocks
Positive/negative income shocks, in million Vietnamese
dong (VND)
À0.53
0.68
Number of weddings [during past 2 years]
0.26
9.66
*
Number of deaths (dependent members)
0.06 59.89
**
Number of deaths (working members)
0.02 À18.67
**
Number of sick days (dependent members)
2.92 À0.39
**
Number of sick days (working members)
2.90
0.38
Dummy ¼ 1 if household experienced a crop failure
[during past 2 years]
0.41 19.28
**
Asset based
proxies
Travel time from household to Yen Chau on motorbike
(in minutes)
43.79
0.15
Number of alternative buyers of maize
3.36
1.51
Total cultivated land per capita (‘000 m
2
)
3.48 À3.70
**
Labor capacity ¼ household size* (household members
(15–60 years)/all household members)
0.18 42.60
Number of organizations per adult
1.50
7.14
Constant
À12.64
Diagnostics N ¼ 287 F(14,272) ¼ 2.27
*** R-squared ¼ 0.18
***
, (
**
), [
*
] p < 0.01, (0.05), [0.1]
3 The full set of expenditure categories included food (rice, other cereals, animal products, oils,
vegetables, fruits, condiments, snacks and alcohol), clothing, health, education, utilities and
housing, social and family events, and fuels. The design of the expenditure module was based
on the Living Standards Measurement Surveys (LSMS).
468
M. Zeller et al.