

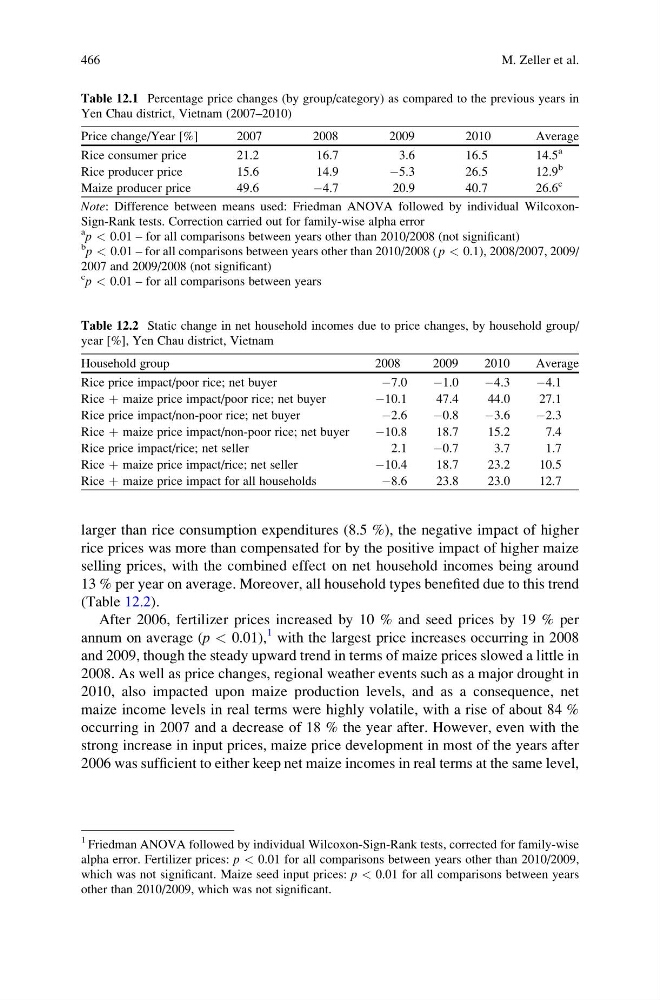
larger than rice consumption expenditures (8.5 %), the negative impact of higher
rice prices was more than compensated for by the positive impact of higher maize
selling prices, with the combined effect on net household incomes being around
13 % per year on average. Moreover, all household types benefited due to this trend
(Table 12.2).
After 2006, fertilizer prices increased by 10 % and seed prices by 19 % per
annum on average (p < 0.01),
1 with the largest price increases occurring in 2008
and 2009, though the steady upward trend in terms of maize prices slowed a little in
2008. As well as price changes, regional weather events such as a major drought in
2010, also impacted upon maize production levels, and as a consequence, net
maize income levels in real terms were highly volatile, with a rise of about 84 %
occurring in 2007 and a decrease of 18 % the year after. However, even with the
strong increase in input prices, maize price development in most of the years after
2006 was sufficient to either keep net maize incomes in real terms at the same level,
Table 12.1 Percentage price changes (by group/category) as compared to the previous years in
Yen Chau district, Vietnam (2007–2010)
Price change/Year [%]
2007
2008
2009
2010
Average
Rice consumer price
21.2
16.7
3.6
16.5
14.5
a
Rice producer price
15.6
14.9
À5.3
26.5
12.9
b
Maize producer price
49.6
À4.7
20.9
40.7
26.6
c
Note: Difference between means used: Friedman ANOVA followed by individual WilcoxonSign-Rank tests. Correction carried out for family-wise alpha error
a
p < 0.01 – for all comparisons between years other than 2010/2008 (not significant)
b
p < 0.01 – for all comparisons between years other than 2010/2008 ( p < 0.1), 2008/2007, 2009/
2007 and 2009/2008 (not significant)
c
p < 0.01 – for all comparisons between years
Table 12.2 Static change in net household incomes due to price changes, by household group/
year [%], Yen Chau district, Vietnam
Household group
2008
2009
2010
Average
Rice price impact/poor rice; net buyer
À7.0
À1.0
À4.3
À4.1
Rice þ maize price impact/poor rice; net buyer
À10.1
47.4
44.0
27.1
Rice price impact/non-poor rice; net buyer
À2.6
À0.8
À3.6
À2.3
Rice þ maize price impact/non-poor rice; net buyer
À10.8
18.7
15.2
7.4
Rice price impact/rice; net seller
2.1
À0.7
3.7
1.7
Rice þ maize price impact/rice; net seller
À10.4
18.7
23.2
10.5
Rice þ maize price impact for all households
À8.6
23.8
23.0
12.7
1 Friedman ANOVA followed by individual Wilcoxon-Sign-Rank tests, corrected for family-wise
alpha error. Fertilizer prices: p < 0.01 for all comparisons between years other than 2010/2009,
which was not significant. Maize seed input prices: p < 0.01 for all comparisons between years
other than 2010/2009, which was not significant.
466
M. Zeller et al.
rice prices was more than compensated for by the positive impact of higher maize
selling prices, with the combined effect on net household incomes being around
13 % per year on average. Moreover, all household types benefited due to this trend
(Table 12.2).
After 2006, fertilizer prices increased by 10 % and seed prices by 19 % per
annum on average (p < 0.01),
1 with the largest price increases occurring in 2008
and 2009, though the steady upward trend in terms of maize prices slowed a little in
2008. As well as price changes, regional weather events such as a major drought in
2010, also impacted upon maize production levels, and as a consequence, net
maize income levels in real terms were highly volatile, with a rise of about 84 %
occurring in 2007 and a decrease of 18 % the year after. However, even with the
strong increase in input prices, maize price development in most of the years after
2006 was sufficient to either keep net maize incomes in real terms at the same level,
Table 12.1 Percentage price changes (by group/category) as compared to the previous years in
Yen Chau district, Vietnam (2007–2010)
Price change/Year [%]
2007
2008
2009
2010
Average
Rice consumer price
21.2
16.7
3.6
16.5
14.5
a
Rice producer price
15.6
14.9
À5.3
26.5
12.9
b
Maize producer price
49.6
À4.7
20.9
40.7
26.6
c
Note: Difference between means used: Friedman ANOVA followed by individual WilcoxonSign-Rank tests. Correction carried out for family-wise alpha error
a
p < 0.01 – for all comparisons between years other than 2010/2008 (not significant)
b
p < 0.01 – for all comparisons between years other than 2010/2008 ( p < 0.1), 2008/2007, 2009/
2007 and 2009/2008 (not significant)
c
p < 0.01 – for all comparisons between years
Table 12.2 Static change in net household incomes due to price changes, by household group/
year [%], Yen Chau district, Vietnam
Household group
2008
2009
2010
Average
Rice price impact/poor rice; net buyer
À7.0
À1.0
À4.3
À4.1
Rice þ maize price impact/poor rice; net buyer
À10.1
47.4
44.0
27.1
Rice price impact/non-poor rice; net buyer
À2.6
À0.8
À3.6
À2.3
Rice þ maize price impact/non-poor rice; net buyer
À10.8
18.7
15.2
7.4
Rice price impact/rice; net seller
2.1
À0.7
3.7
1.7
Rice þ maize price impact/rice; net seller
À10.4
18.7
23.2
10.5
Rice þ maize price impact for all households
À8.6
23.8
23.0
12.7
1 Friedman ANOVA followed by individual Wilcoxon-Sign-Rank tests, corrected for family-wise
alpha error. Fertilizer prices: p < 0.01 for all comparisons between years other than 2010/2009,
which was not significant. Maize seed input prices: p < 0.01 for all comparisons between years
other than 2010/2009, which was not significant.
466
M. Zeller et al.