

12.2 Volatility of Agricultural Commodity Prices
and Its Impact on Household Incomes and Consumption
In Vietnam, the period from 2006 to 2010 witnessed substantial fluctuations in
agricultural input and output prices, as well as a general upward trend in food,
feed and fertilizer prices. In this section, we discuss and report on price developments
within the study area based on a representative household survey carried out in Yen
Chau district – a mountainous district in north-western Vietnam (Ufer forthcoming).
Yen Chau is one of the poorest districts in the country, with 17 % of households
living below the national rural poverty line in 2007. Households in this area are
highly dependent on two key crops, these being rice – to a large degree for
subsistence purposes and comprising 11 % of the total farmed area and 8.5 % of
total consumption expenditures, and maize – the main cash crop and which covers
71 % of the total farmed area and constitutes 65 % of total household cash income.
Both crops are cultivated using a high level of inputs and modern hybrid varieties,
yet it is predominantly maize which is sold on the market. Approximately half of
the households are self-sufficient in rice, with 7 % being net sellers also. In contrast,
97 % of households are net sellers of maize – selling almost all of their produce.
Table 12.1 shows percentage changes in the consumer and producer prices of rice,
and the producer price of maize over the study period (2007–2010). Table 12.2
shows the static changes that took place over this period in terms of net household
incomes, due to the observed price changes.
Over the five study years, both rice consumer and maize producer prices
increased considerably, by approximately 15 % and 27 % per annum respectively
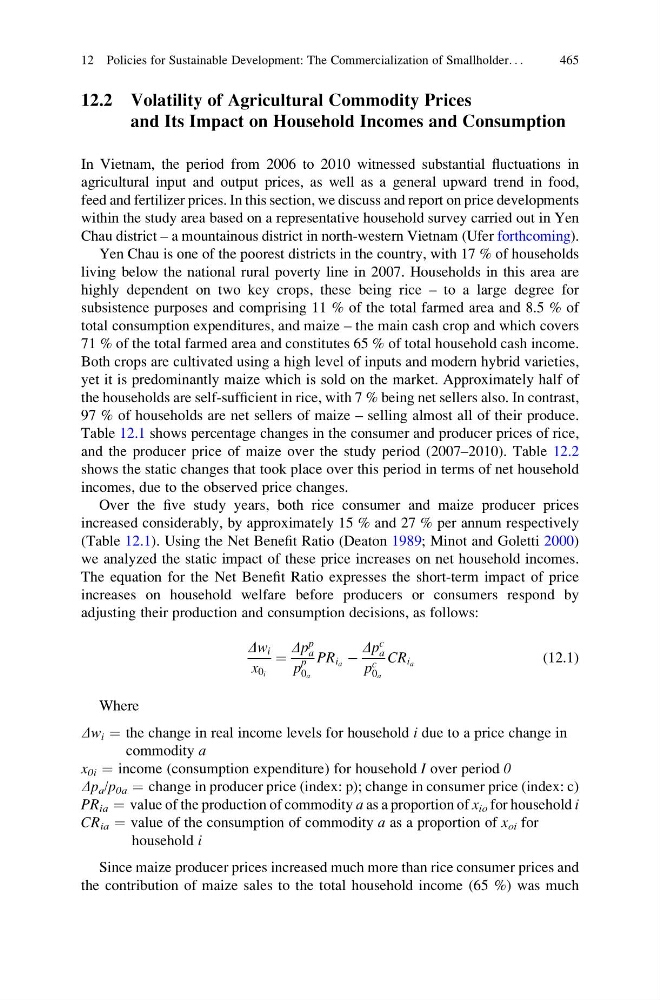
(Table 12.1). Using the Net Benefit Ratio (Deaton 1989; Minot and Goletti 2000)
we analyzed the static impact of these price increases on net household incomes.
The equation for the Net Benefit Ratio expresses the short-term impact of price
increases on household welfare before producers or consumers respond by
adjusting their production and consumption decisions, as follows:
Dw i
x 0 i
¼
Dp
p
a
p
p
0 a
PR i a À
Dp
c
a
p
c
0 a
CR i a
(12.1)
Where
Dw i ¼ the change in real income levels for household i due to a price change in
commodity a
x 0i ¼ income (consumption expenditure) for household I over period 0
Dp a /p 0a ¼ change in producer price (index: p); change in consumer price (index: c)
PR ia ¼ value of the production of commodity a as a proportion of x io for household i
CR ia ¼ value of the consumption of commodity a as a proportion of x oi for
household i
Since maize producer prices increased much more than rice consumer prices and
the contribution of maize sales to the total household income (65 %) was much
12 Policies for Sustainable Development: The Commercialization of Smallholder. . .
465
and Its Impact on Household Incomes and Consumption
In Vietnam, the period from 2006 to 2010 witnessed substantial fluctuations in
agricultural input and output prices, as well as a general upward trend in food,
feed and fertilizer prices. In this section, we discuss and report on price developments
within the study area based on a representative household survey carried out in Yen
Chau district – a mountainous district in north-western Vietnam (Ufer forthcoming).
Yen Chau is one of the poorest districts in the country, with 17 % of households
living below the national rural poverty line in 2007. Households in this area are
highly dependent on two key crops, these being rice – to a large degree for
subsistence purposes and comprising 11 % of the total farmed area and 8.5 % of
total consumption expenditures, and maize – the main cash crop and which covers
71 % of the total farmed area and constitutes 65 % of total household cash income.
Both crops are cultivated using a high level of inputs and modern hybrid varieties,
yet it is predominantly maize which is sold on the market. Approximately half of
the households are self-sufficient in rice, with 7 % being net sellers also. In contrast,
97 % of households are net sellers of maize – selling almost all of their produce.
Table 12.1 shows percentage changes in the consumer and producer prices of rice,
and the producer price of maize over the study period (2007–2010). Table 12.2
shows the static changes that took place over this period in terms of net household
incomes, due to the observed price changes.
Over the five study years, both rice consumer and maize producer prices
increased considerably, by approximately 15 % and 27 % per annum respectively
(Table 12.1). Using the Net Benefit Ratio (Deaton 1989; Minot and Goletti 2000)
we analyzed the static impact of these price increases on net household incomes.
The equation for the Net Benefit Ratio expresses the short-term impact of price
increases on household welfare before producers or consumers respond by
adjusting their production and consumption decisions, as follows:
Dw i
x 0 i
¼
Dp
p
a
p
p
0 a
PR i a À
Dp
c
a
p
c
0 a
CR i a
(12.1)
Where
Dw i ¼ the change in real income levels for household i due to a price change in
commodity a
x 0i ¼ income (consumption expenditure) for household I over period 0
Dp a /p 0a ¼ change in producer price (index: p); change in consumer price (index: c)
PR ia ¼ value of the production of commodity a as a proportion of x io for household i
CR ia ¼ value of the consumption of commodity a as a proportion of x oi for
household i
Since maize producer prices increased much more than rice consumer prices and
the contribution of maize sales to the total household income (65 %) was much
12 Policies for Sustainable Development: The Commercialization of Smallholder. . .
465