

scenarios B, C and D these strategies were replaced by soil conservation, in so far as
areas under soil conservation increased at the cost of areas under F0 and F2.
Average maize yields under the given land use and fertilizer regimes differed
clearly between the baseline and the no tillage treatment (steady decrease from
about 7 to 4 Mg ha
À1 ), while cover crop treatments steadily increased from year 3
(from about 5 to 7 Mg ha
À1
).
In the coupled model, cumulative sediment loads after 25 years passing the
catchment outflow point that drained most of the maize areas, amounted to 79 % in
the baseline erosion of the standalone version. Differences between treatments at
the catchment outflow level were negligible. Absolute values of sediment loads
(e.g., 463,000 Mg ha
À1 in the coupled baseline) appeared over-estimated on first
sight, but corresponded to 160 kg ha
À1 year
À1 as an average over all pixels,
including all sediment loads from the sub-catchment originating in and travelling
through the respective pixels.
In contrast to the LUCIA standalone simulation, it was not possible to single out
the effects of soil conservation measures, due to the fact that soil conservation was
applied only on maize plots, but maize was grown on different plots every year, in
other words, crops on the individual plots were rotated. Yields and erosion were
compared after the fifth year between the baselines of both approaches, after some
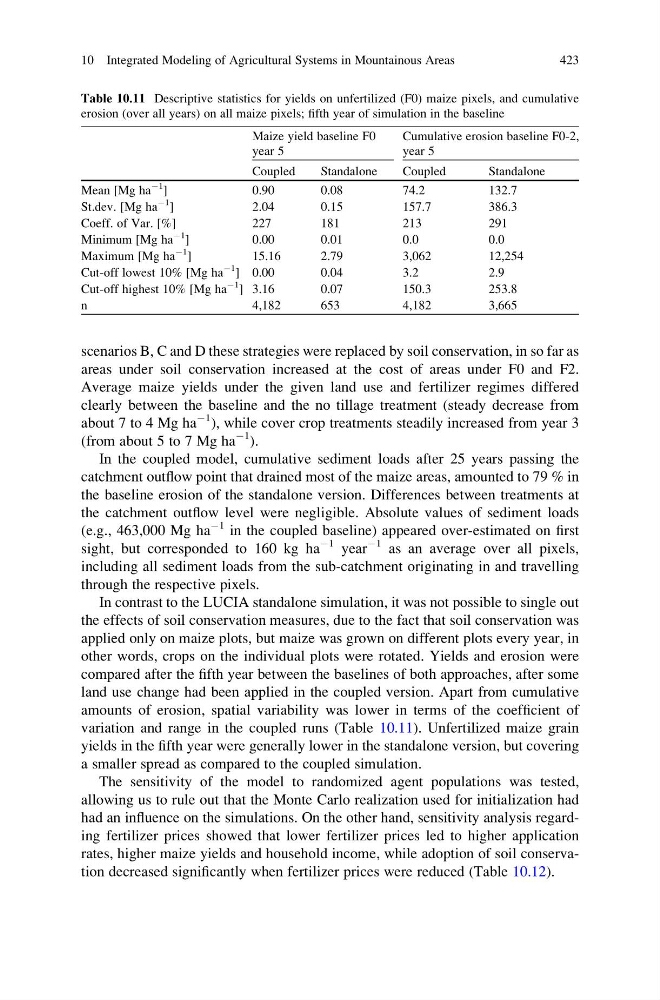
land use change had been applied in the coupled version. Apart from cumulative
amounts of erosion, spatial variability was lower in terms of the coefficient of
variation and range in the coupled runs (Table 10.11). Unfertilized maize grain
yields in the fifth year were generally lower in the standalone version, but covering
a smaller spread as compared to the coupled simulation.
The sensitivity of the model to randomized agent populations was tested,
allowing us to rule out that the Monte Carlo realization used for initialization had
had an influence on the simulations. On the other hand, sensitivity analysis regarding fertilizer prices showed that lower fertilizer prices led to higher application
rates, higher maize yields and household income, while adoption of soil conservation decreased significantly when fertilizer prices were reduced (Table 10.12).
Table 10.11 Descriptive statistics for yields on unfertilized (F0) maize pixels, and cumulative
erosion (over all years) on all maize pixels; fifth year of simulation in the baseline
Maize yield baseline F0
year 5
Cumulative erosion baseline F0-2,
year 5
Coupled
Standalone
Coupled
Standalone
Mean [Mg ha
À1
]
0.90
0.08
74.2
132.7
St.dev. [Mg ha
À1
]
2.04
0.15
157.7
386.3
Coeff. of Var. [%]
227
181
213
291
Minimum [Mg ha
À1
]
0.00
0.01
0.0
0.0
Maximum [Mg ha
À1
]
15.16
2.79
3,062
12,254
Cut-off lowest 10% [Mg ha
À1
] 0.00
0.04
3.2
2.9
Cut-off highest 10% [Mg ha
À1
] 3.16
0.07
150.3
253.8
n
4,182
653
4,182
3,665
10 Integrated Modeling of Agricultural Systems in Mountainous Areas
423
areas under soil conservation increased at the cost of areas under F0 and F2.
Average maize yields under the given land use and fertilizer regimes differed
clearly between the baseline and the no tillage treatment (steady decrease from
about 7 to 4 Mg ha
À1 ), while cover crop treatments steadily increased from year 3
(from about 5 to 7 Mg ha
À1
).
In the coupled model, cumulative sediment loads after 25 years passing the
catchment outflow point that drained most of the maize areas, amounted to 79 % in
the baseline erosion of the standalone version. Differences between treatments at
the catchment outflow level were negligible. Absolute values of sediment loads
(e.g., 463,000 Mg ha
À1 in the coupled baseline) appeared over-estimated on first
sight, but corresponded to 160 kg ha
À1 year
À1 as an average over all pixels,
including all sediment loads from the sub-catchment originating in and travelling
through the respective pixels.
In contrast to the LUCIA standalone simulation, it was not possible to single out
the effects of soil conservation measures, due to the fact that soil conservation was
applied only on maize plots, but maize was grown on different plots every year, in
other words, crops on the individual plots were rotated. Yields and erosion were
compared after the fifth year between the baselines of both approaches, after some
land use change had been applied in the coupled version. Apart from cumulative
amounts of erosion, spatial variability was lower in terms of the coefficient of
variation and range in the coupled runs (Table 10.11). Unfertilized maize grain
yields in the fifth year were generally lower in the standalone version, but covering
a smaller spread as compared to the coupled simulation.
The sensitivity of the model to randomized agent populations was tested,
allowing us to rule out that the Monte Carlo realization used for initialization had
had an influence on the simulations. On the other hand, sensitivity analysis regarding fertilizer prices showed that lower fertilizer prices led to higher application
rates, higher maize yields and household income, while adoption of soil conservation decreased significantly when fertilizer prices were reduced (Table 10.12).
Table 10.11 Descriptive statistics for yields on unfertilized (F0) maize pixels, and cumulative
erosion (over all years) on all maize pixels; fifth year of simulation in the baseline
Maize yield baseline F0
year 5
Cumulative erosion baseline F0-2,
year 5
Coupled
Standalone
Coupled
Standalone
Mean [Mg ha
À1
]
0.90
0.08
74.2
132.7
St.dev. [Mg ha
À1
]
2.04
0.15
157.7
386.3
Coeff. of Var. [%]
227
181
213
291
Minimum [Mg ha
À1
]
0.00
0.01
0.0
0.0
Maximum [Mg ha
À1
]
15.16
2.79
3,062
12,254
Cut-off lowest 10% [Mg ha
À1
] 0.00
0.04
3.2
2.9
Cut-off highest 10% [Mg ha
À1
] 3.16
0.07
150.3
253.8
n
4,182
653
4,182
3,665
10 Integrated Modeling of Agricultural Systems in Mountainous Areas
423