

10.8.3 Results
10.8.3.1 Model Validation
The baseline was validated with data for household resource endowments and the
aggregated cropping areas for upland crops. In addition, crop yields and income
distribution were validated. For all parameters satisfactory fit was achieved (data
not shown; for details please refer to Marohn et al. in press).
10.8.3.2 Scenario Outputs
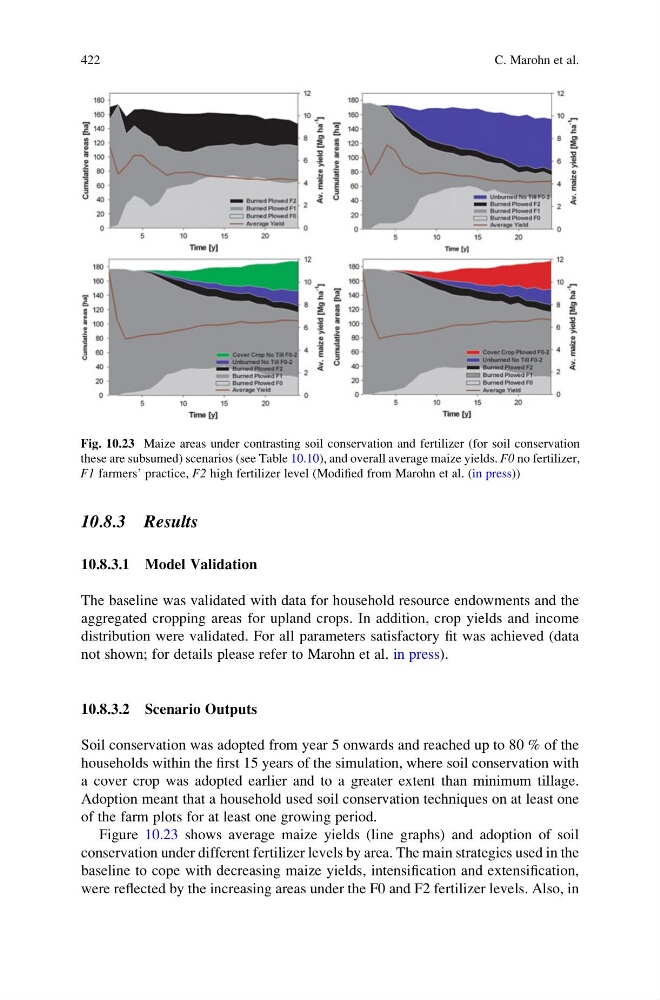
Soil conservation was adopted from year 5 onwards and reached up to 80 % of the
households within the first 15 years of the simulation, where soil conservation with
a cover crop was adopted earlier and to a greater extent than minimum tillage.
Adoption meant that a household used soil conservation techniques on at least one
of the farm plots for at least one growing period.
Figure 10.23 shows average maize yields (line graphs) and adoption of soil
conservation under different fertilizer levels by area. The main strategies used in the
baseline to cope with decreasing maize yields, intensification and extensification,
were reflected by the increasing areas under the F0 and F2 fertilizer levels. Also, in
Fig. 10.23 Maize areas under contrasting soil conservation and fertilizer (for soil conservation
these are subsumed) scenarios (see Table 10.10), and overall average maize yields. F0 no fertilizer,
F1 farmers’ practice, F2 high fertilizer level (Modified from Marohn et al. (in press))
422
C. Marohn et al.
10.8.3.1 Model Validation
The baseline was validated with data for household resource endowments and the
aggregated cropping areas for upland crops. In addition, crop yields and income
distribution were validated. For all parameters satisfactory fit was achieved (data
not shown; for details please refer to Marohn et al. in press).
10.8.3.2 Scenario Outputs
Soil conservation was adopted from year 5 onwards and reached up to 80 % of the
households within the first 15 years of the simulation, where soil conservation with
a cover crop was adopted earlier and to a greater extent than minimum tillage.
Adoption meant that a household used soil conservation techniques on at least one
of the farm plots for at least one growing period.
Figure 10.23 shows average maize yields (line graphs) and adoption of soil
conservation under different fertilizer levels by area. The main strategies used in the
baseline to cope with decreasing maize yields, intensification and extensification,
were reflected by the increasing areas under the F0 and F2 fertilizer levels. Also, in
Fig. 10.23 Maize areas under contrasting soil conservation and fertilizer (for soil conservation
these are subsumed) scenarios (see Table 10.10), and overall average maize yields. F0 no fertilizer,
F1 farmers’ practice, F2 high fertilizer level (Modified from Marohn et al. (in press))
422
C. Marohn et al.