

Simulated land use change trajectories were evaluated by drawing on the
multiple-resolution goodness-of-fit (GOF) procedure (Costanza 1989), and using
land cover maps derived from a Syste `me Pour l’Observation de la Terre (SPOT)
satellite image taken in 1992 and a Linear Imaging Self-Scanning Sensor (LISS III)
satellite image taken in 2007 (Thi et al. 2009). The GOF statistical technique is
based on the measurement of pattern similarity between simulated and observed
land use change, where one denotes a perfect model fit. The analysis revealed that
FALLOW reflected the development of land use and land cover reasonably well,
with a GOF value of 0.78. The increase in cropping area during the simulation
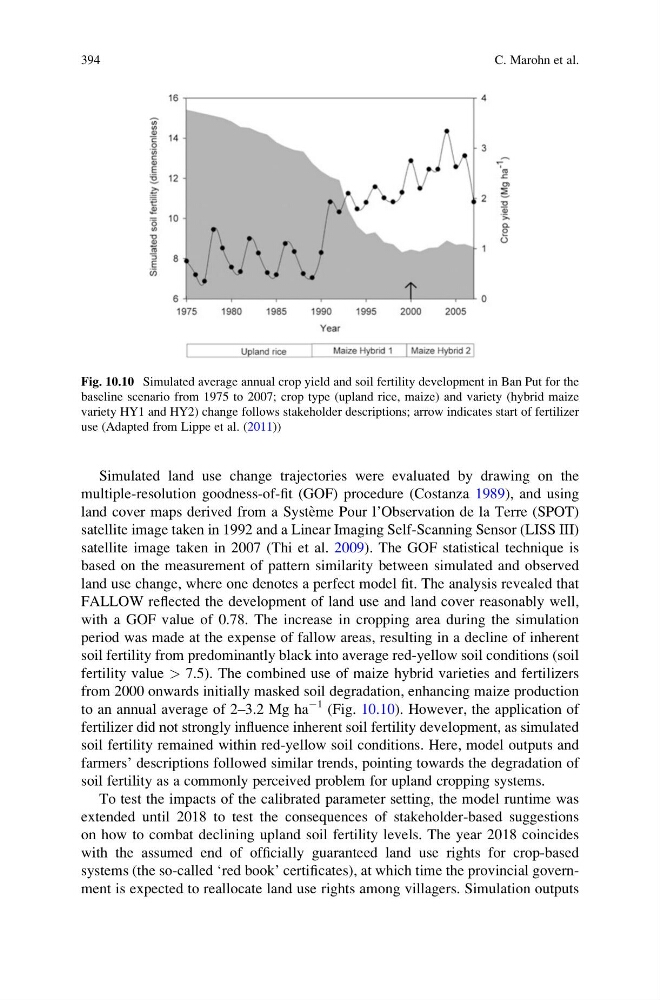
period was made at the expense of fallow areas, resulting in a decline of inherent
soil fertility from predominantly black into average red-yellow soil conditions (soil
fertility value > 7.5). The combined use of maize hybrid varieties and fertilizers
from 2000 onwards initially masked soil degradation, enhancing maize production
to an annual average of 2–3.2 Mg ha
À1 (Fig. 10.10). However, the application of
fertilizer did not strongly influence inherent soil fertility development, as simulated
soil fertility remained within red-yellow soil conditions. Here, model outputs and
farmers’ descriptions followed similar trends, pointing towards the degradation of
soil fertility as a commonly perceived problem for upland cropping systems.
To test the impacts of the calibrated parameter setting, the model runtime was
extended until 2018 to test the consequences of stakeholder-based suggestions
on how to combat declining upland soil fertility levels. The year 2018 coincides
with the assumed end of officially guaranteed land use rights for crop-based
systems (the so-called ‘red book’ certificates), at which time the provincial government is expected to reallocate land use rights among villagers. Simulation outputs
Fig. 10.10 Simulated average annual crop yield and soil fertility development in Ban Put for the
baseline scenario from 1975 to 2007; crop type (upland rice, maize) and variety (hybrid maize
variety HY1 and HY2) change follows stakeholder descriptions; arrow indicates start of fertilizer
use (Adapted from Lippe et al. (2011))
394
C. Marohn et al.
multiple-resolution goodness-of-fit (GOF) procedure (Costanza 1989), and using
land cover maps derived from a Syste `me Pour l’Observation de la Terre (SPOT)
satellite image taken in 1992 and a Linear Imaging Self-Scanning Sensor (LISS III)
satellite image taken in 2007 (Thi et al. 2009). The GOF statistical technique is
based on the measurement of pattern similarity between simulated and observed
land use change, where one denotes a perfect model fit. The analysis revealed that
FALLOW reflected the development of land use and land cover reasonably well,
with a GOF value of 0.78. The increase in cropping area during the simulation
period was made at the expense of fallow areas, resulting in a decline of inherent
soil fertility from predominantly black into average red-yellow soil conditions (soil
fertility value > 7.5). The combined use of maize hybrid varieties and fertilizers
from 2000 onwards initially masked soil degradation, enhancing maize production
to an annual average of 2–3.2 Mg ha
À1 (Fig. 10.10). However, the application of
fertilizer did not strongly influence inherent soil fertility development, as simulated
soil fertility remained within red-yellow soil conditions. Here, model outputs and
farmers’ descriptions followed similar trends, pointing towards the degradation of
soil fertility as a commonly perceived problem for upland cropping systems.
To test the impacts of the calibrated parameter setting, the model runtime was
extended until 2018 to test the consequences of stakeholder-based suggestions
on how to combat declining upland soil fertility levels. The year 2018 coincides
with the assumed end of officially guaranteed land use rights for crop-based
systems (the so-called ‘red book’ certificates), at which time the provincial government is expected to reallocate land use rights among villagers. Simulation outputs
Fig. 10.10 Simulated average annual crop yield and soil fertility development in Ban Put for the
baseline scenario from 1975 to 2007; crop type (upland rice, maize) and variety (hybrid maize
variety HY1 and HY2) change follows stakeholder descriptions; arrow indicates start of fertilizer
use (Adapted from Lippe et al. (2011))
394
C. Marohn et al.