

3.4.3 Impact of Matter Reallocation on Lowland Soil Fertility
and Crop Production
In intensively cultivated areas, nutrient losses in one part of a catchment can lead to
gains elsewhere (Fig. 3.12). This is often the case in mountainous regions where
there is a strong linkage between upland erosion processes and lowland deposition
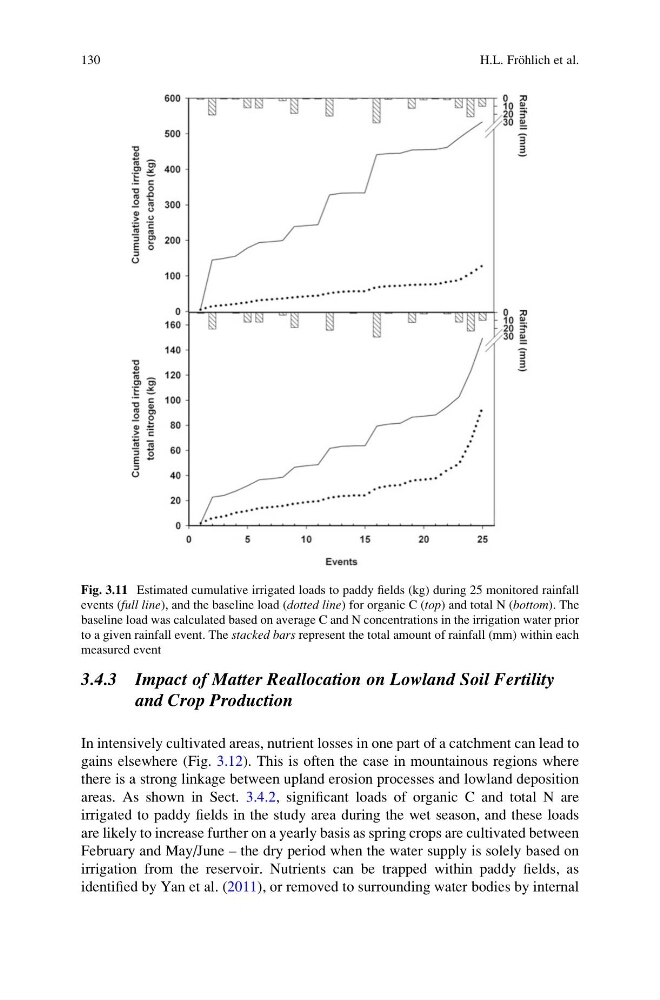
areas. As shown in Sect. 3.4.2, significant loads of organic C and total N are
irrigated to paddy fields in the study area during the wet season, and these loads
are likely to increase further on a yearly basis as spring crops are cultivated between
February and May/June – the dry period when the water supply is solely based on
irrigation from the reservoir. Nutrients can be trapped within paddy fields, as
identified by Yan et al. (2011), or removed to surrounding water bodies by internal
Fig. 3.11 Estimated cumulative irrigated loads to paddy fields (kg) during 25 monitored rainfall
events (full line), and the baseline load (dotted line) for organic C (top) and total N (bottom). The
baseline load was calculated based on average C and N concentrations in the irrigation water prior
to a given rainfall event. The stacked bars represent the total amount of rainfall (mm) within each
measured event
130
H.L. Fro ¨hlich et al.
and Crop Production
In intensively cultivated areas, nutrient losses in one part of a catchment can lead to
gains elsewhere (Fig. 3.12). This is often the case in mountainous regions where
there is a strong linkage between upland erosion processes and lowland deposition
areas. As shown in Sect. 3.4.2, significant loads of organic C and total N are
irrigated to paddy fields in the study area during the wet season, and these loads
are likely to increase further on a yearly basis as spring crops are cultivated between
February and May/June – the dry period when the water supply is solely based on
irrigation from the reservoir. Nutrients can be trapped within paddy fields, as
identified by Yan et al. (2011), or removed to surrounding water bodies by internal
Fig. 3.11 Estimated cumulative irrigated loads to paddy fields (kg) during 25 monitored rainfall
events (full line), and the baseline load (dotted line) for organic C (top) and total N (bottom). The
baseline load was calculated based on average C and N concentrations in the irrigation water prior
to a given rainfall event. The stacked bars represent the total amount of rainfall (mm) within each
measured event
130
H.L. Fro ¨hlich et al.