

estimated for rainfall events. These loads were then compared with calculated
irrigated loads in the absence of rainfall events (i.e., irrigated baseline loads). For
these baseline loads, the water quality in the irrigation channel at the onset of the
rain was used. Comparing both loads enabled the identification of rainfall induced
load contributions, i.e., loads from overland flows, which showed a significant
contribution to nutrient loads irrigated to the paddies (Fig. 3.11). Over the measured
events, an additional organic C load of 406 kg and total N load of 56 kg was
irrigated into the paddy fields as compared to the total irrigated baseline loads,
showing the event scale impact of rainfall and irrigation management on irrigated
nutrient loads.
In a next step, rainfall intensity, overland flow, irrigation discharge and water
levels in the reservoir were used to estimate irrigation loads over the entire period,
from May to September, using multiple linear regression. Over this period, rainfall
contributed up to 7 % of the overall irrigated organic C loads and 1.8 % to the total
N loads. The model predicted a total irrigated load of 5.5 Mg of organic C and
4.6 Mg of total N to the paddy fields. Given the irrigated paddy area of 6.5 ha, this
prediction resulted in an additional spatially averaged load of 0.85 Mg ha
À1 organic
C and 0.70 Mg ha
À1 total N (Schmitter et al. 2012), while the management and
water quality of the reservoir accounted for up to 93 % of the overall irrigated loads.
The reservoir normally captures the overland flow of organic C and N from the
surrounding, intensively cultivated 490 ha area and releases it throughout the year
through irrigation to the paddy area. As such, the reservoir acts as a sediment filter
and, depending on reservoir management practices, changes the timing and fingerprint of nutrient allocation to the rice fields.
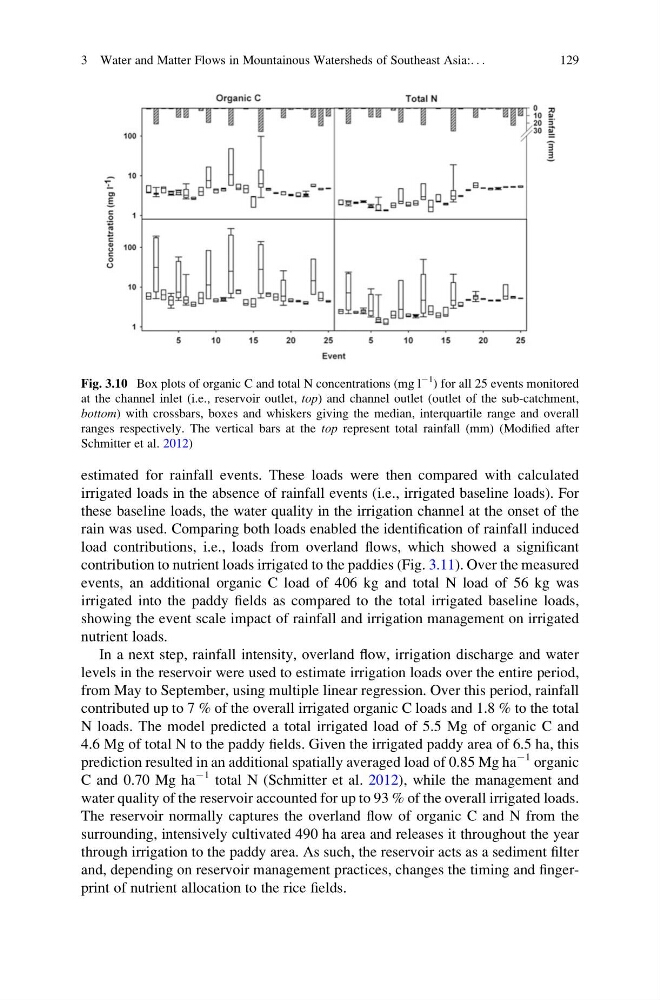
Fig. 3.10 Box plots of organic C and total N concentrations (mg l
À1
) for all 25 events monitored
at the channel inlet (i.e., reservoir outlet, top) and channel outlet (outlet of the sub-catchment,
bottom) with crossbars, boxes and whiskers giving the median, interquartile range and overall
ranges respectively. The vertical bars at the top represent total rainfall (mm) (Modified after
Schmitter et al. 2012)
3 Water and Matter Flows in Mountainous Watersheds of Southeast Asia:. . .
129
irrigated loads in the absence of rainfall events (i.e., irrigated baseline loads). For
these baseline loads, the water quality in the irrigation channel at the onset of the
rain was used. Comparing both loads enabled the identification of rainfall induced
load contributions, i.e., loads from overland flows, which showed a significant
contribution to nutrient loads irrigated to the paddies (Fig. 3.11). Over the measured
events, an additional organic C load of 406 kg and total N load of 56 kg was
irrigated into the paddy fields as compared to the total irrigated baseline loads,
showing the event scale impact of rainfall and irrigation management on irrigated
nutrient loads.
In a next step, rainfall intensity, overland flow, irrigation discharge and water
levels in the reservoir were used to estimate irrigation loads over the entire period,
from May to September, using multiple linear regression. Over this period, rainfall
contributed up to 7 % of the overall irrigated organic C loads and 1.8 % to the total
N loads. The model predicted a total irrigated load of 5.5 Mg of organic C and
4.6 Mg of total N to the paddy fields. Given the irrigated paddy area of 6.5 ha, this
prediction resulted in an additional spatially averaged load of 0.85 Mg ha
À1 organic
C and 0.70 Mg ha
À1 total N (Schmitter et al. 2012), while the management and
water quality of the reservoir accounted for up to 93 % of the overall irrigated loads.
The reservoir normally captures the overland flow of organic C and N from the
surrounding, intensively cultivated 490 ha area and releases it throughout the year
through irrigation to the paddy area. As such, the reservoir acts as a sediment filter
and, depending on reservoir management practices, changes the timing and fingerprint of nutrient allocation to the rice fields.
Fig. 3.10 Box plots of organic C and total N concentrations (mg l
À1
) for all 25 events monitored
at the channel inlet (i.e., reservoir outlet, top) and channel outlet (outlet of the sub-catchment,
bottom) with crossbars, boxes and whiskers giving the median, interquartile range and overall
ranges respectively. The vertical bars at the top represent total rainfall (mm) (Modified after
Schmitter et al. 2012)
3 Water and Matter Flows in Mountainous Watersheds of Southeast Asia:. . .
129