

7.5 Friction Optimization
483
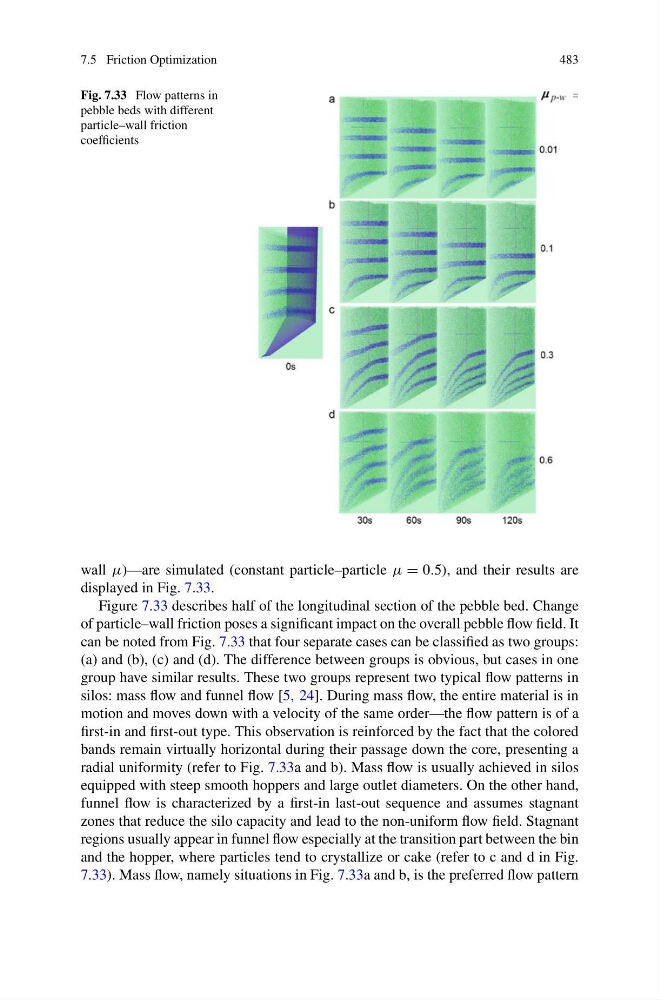
Fig. 7.33 Flow patterns in
pebble beds with different
particle–wall friction
coefficients
wall μ)—are simulated (constant particle–particle μ = 0.5), and their results are
displayed in Fig. 7.33.
Figure 7.33 describes half of the longitudinal section of the pebble bed. Change
of particle–wall friction poses a significant impact on the overall pebble flow field. It
can be noted from Fig. 7.33 that four separate cases can be classified as two groups:
(a) and (b), (c) and (d). The difference between groups is obvious, but cases in one
group have similar results. These two groups represent two typical flow patterns in
silos: mass flow and funnel flow [5, 24]. During mass flow, the entire material is in
motion and moves down with a velocity of the same order—the flow pattern is of a
first-in and first-out type. This observation is reinforced by the fact that the colored
bands remain virtually horizontal during their passage down the core, presenting a
radial uniformity (refer to Fig. 7.33a and b). Mass flow is usually achieved in silos
equipped with steep smooth hoppers and large outlet diameters. On the other hand,
funnel flow is characterized by a first-in last-out sequence and assumes stagnant
zones that reduce the silo capacity and lead to the non-uniform flow field. Stagnant
regions usually appear in funnel flow especially at the transition part between the bin
and the hopper, where particles tend to crystallize or cake (refer to c and d in Fig.
7.33). Mass flow, namely situations in Fig. 7.33a and b, is the preferred flow pattern
483
Fig. 7.33 Flow patterns in
pebble beds with different
particle–wall friction
coefficients
wall μ)—are simulated (constant particle–particle μ = 0.5), and their results are
displayed in Fig. 7.33.
Figure 7.33 describes half of the longitudinal section of the pebble bed. Change
of particle–wall friction poses a significant impact on the overall pebble flow field. It
can be noted from Fig. 7.33 that four separate cases can be classified as two groups:
(a) and (b), (c) and (d). The difference between groups is obvious, but cases in one
group have similar results. These two groups represent two typical flow patterns in
silos: mass flow and funnel flow [5, 24]. During mass flow, the entire material is in
motion and moves down with a velocity of the same order—the flow pattern is of a
first-in and first-out type. This observation is reinforced by the fact that the colored
bands remain virtually horizontal during their passage down the core, presenting a
radial uniformity (refer to Fig. 7.33a and b). Mass flow is usually achieved in silos
equipped with steep smooth hoppers and large outlet diameters. On the other hand,
funnel flow is characterized by a first-in last-out sequence and assumes stagnant
zones that reduce the silo capacity and lead to the non-uniform flow field. Stagnant
regions usually appear in funnel flow especially at the transition part between the bin
and the hopper, where particles tend to crystallize or cake (refer to c and d in Fig.
7.33). Mass flow, namely situations in Fig. 7.33a and b, is the preferred flow pattern