

484
7 Applications: Pebble Flow Optimizations
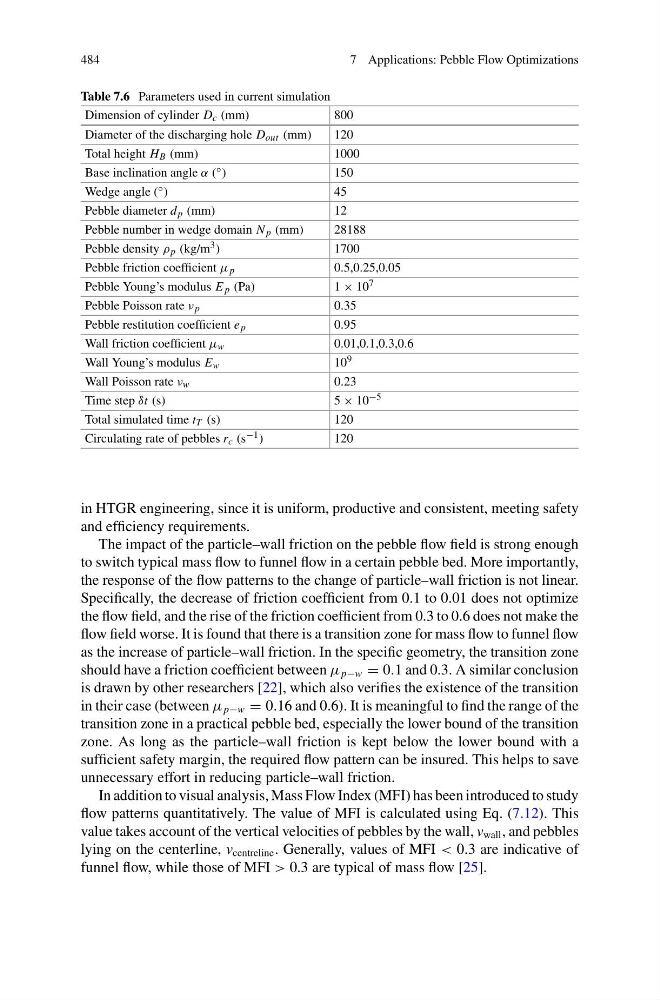
Table 7.6 Parameters used in current simulation
Dimension of cylinder D c (mm)
800
Diameter of the discharging hole D out (mm)
120
Total height H B (mm)
1000
Base inclination angle α ( ◦ )
150
Wedge angle ( ◦ )
45
Pebble diameter d p (mm)
12
Pebble number in wedge domain N p (mm)
28188
Pebble density ρ p (kg/m 3 )
1700
Pebble friction coefficient μ p
0.5,0.25,0.05
Pebble Young’s modulus E p (Pa)
1 × 10 7
Pebble Poisson rate ν p
0.35
Pebble restitution coefficient e p
0.95
Wall friction coefficient μ w
0.01,0.1,0.3,0.6
Wall Young’s modulus E w
10 9
Wall Poisson rate ν w
0.23
Time step δt (s)
5 × 10 −5
Total simulated time t T (s)
120
Circulating rate of pebbles r c (s −1 )
120
in HTGR engineering, since it is uniform, productive and consistent, meeting safety
and efficiency requirements.
The impact of the particle–wall friction on the pebble flow field is strong enough
to switch typical mass flow to funnel flow in a certain pebble bed. More importantly,
the response of the flow patterns to the change of particle–wall friction is not linear.
Specifically, the decrease of friction coefficient from 0.1 to 0.01 does not optimize
the flow field, and the rise of the friction coefficient from 0.3 to 0.6 does not make the
flow field worse. It is found that there is a transition zone for mass flow to funnel flow
as the increase of particle–wall friction. In the specific geometry, the transition zone
should have a friction coefficient between μ p−w = 0.1 and 0.3. A similar conclusion
is drawn by other researchers [22], which also verifies the existence of the transition
in their case (between μ p−w = 0.16 and 0.6). It is meaningful to find the range of the
transition zone in a practical pebble bed, especially the lower bound of the transition
zone. As long as the particle–wall friction is kept below the lower bound with a
sufficient safety margin, the required flow pattern can be insured. This helps to save
unnecessary effort in reducing particle–wall friction.
In addition to visual analysis, Mass Flow Index (MFI) has been introduced to study
flow patterns quantitatively. The value of MFI is calculated using Eq. (7.12). This
value takes account of the vertical velocities of pebbles by the wall, v wall , and pebbles
lying on the centerline, v centreline . Generally, values of MFI < 0.3 are indicative of
funnel flow, while those of MFI > 0.3 are typical of mass flow [25].
7 Applications: Pebble Flow Optimizations
Table 7.6 Parameters used in current simulation
Dimension of cylinder D c (mm)
800
Diameter of the discharging hole D out (mm)
120
Total height H B (mm)
1000
Base inclination angle α ( ◦ )
150
Wedge angle ( ◦ )
45
Pebble diameter d p (mm)
12
Pebble number in wedge domain N p (mm)
28188
Pebble density ρ p (kg/m 3 )
1700
Pebble friction coefficient μ p
0.5,0.25,0.05
Pebble Young’s modulus E p (Pa)
1 × 10 7
Pebble Poisson rate ν p
0.35
Pebble restitution coefficient e p
0.95
Wall friction coefficient μ w
0.01,0.1,0.3,0.6
Wall Young’s modulus E w
10 9
Wall Poisson rate ν w
0.23
Time step δt (s)
5 × 10 −5
Total simulated time t T (s)
120
Circulating rate of pebbles r c (s −1 )
120
in HTGR engineering, since it is uniform, productive and consistent, meeting safety
and efficiency requirements.
The impact of the particle–wall friction on the pebble flow field is strong enough
to switch typical mass flow to funnel flow in a certain pebble bed. More importantly,
the response of the flow patterns to the change of particle–wall friction is not linear.
Specifically, the decrease of friction coefficient from 0.1 to 0.01 does not optimize
the flow field, and the rise of the friction coefficient from 0.3 to 0.6 does not make the
flow field worse. It is found that there is a transition zone for mass flow to funnel flow
as the increase of particle–wall friction. In the specific geometry, the transition zone
should have a friction coefficient between μ p−w = 0.1 and 0.3. A similar conclusion
is drawn by other researchers [22], which also verifies the existence of the transition
in their case (between μ p−w = 0.16 and 0.6). It is meaningful to find the range of the
transition zone in a practical pebble bed, especially the lower bound of the transition
zone. As long as the particle–wall friction is kept below the lower bound with a
sufficient safety margin, the required flow pattern can be insured. This helps to save
unnecessary effort in reducing particle–wall friction.
In addition to visual analysis, Mass Flow Index (MFI) has been introduced to study
flow patterns quantitatively. The value of MFI is calculated using Eq. (7.12). This
value takes account of the vertical velocities of pebbles by the wall, v wall , and pebbles
lying on the centerline, v centreline . Generally, values of MFI < 0.3 are indicative of
funnel flow, while those of MFI > 0.3 are typical of mass flow [25].