

482
7 Applications: Pebble Flow Optimizations
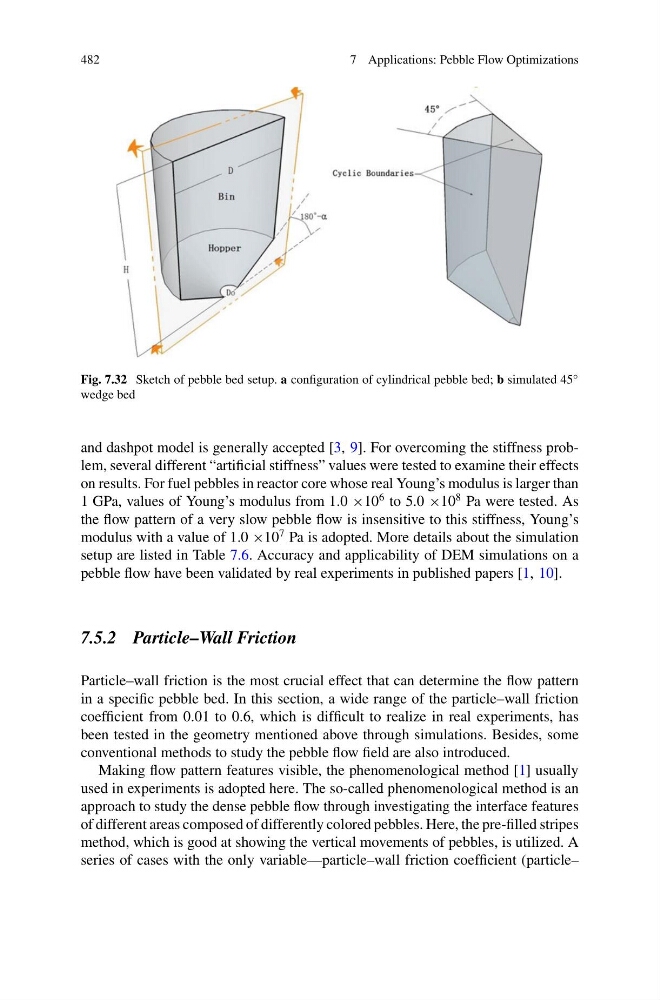
Fig. 7.32 Sketch of pebble bed setup. a configuration of cylindrical pebble bed; b simulated 45 ◦
wedge bed
and dashpot model is generally accepted [3, 9]. For overcoming the stiffness problem, several different “artificial stiffness” values were tested to examine their effects
on results. For fuel pebbles in reactor core whose real Young’s modulus is larger than
1 GPa, values of Young’s modulus from 1.0 ×10
6 to 5.0 ×10
8 Pa were tested. As
the flow pattern of a very slow pebble flow is insensitive to this stiffness, Young’s
modulus with a value of 1.0 ×10
7 Pa is adopted. More details about the simulation
setup are listed in Table 7.6. Accuracy and applicability of DEM simulations on a
pebble flow have been validated by real experiments in published papers [1, 10].
7.5.2 Particle–Wall Friction
Particle–wall friction is the most crucial effect that can determine the flow pattern
in a specific pebble bed. In this section, a wide range of the particle–wall friction
coefficient from 0.01 to 0.6, which is difficult to realize in real experiments, has
been tested in the geometry mentioned above through simulations. Besides, some
conventional methods to study the pebble flow field are also introduced.
Making flow pattern features visible, the phenomenological method [1] usually
used in experiments is adopted here. The so-called phenomenological method is an
approach to study the dense pebble flow through investigating the interface features
of different areas composed of differently colored pebbles. Here, the pre-filled stripes
method, which is good at showing the vertical movements of pebbles, is utilized. A
series of cases with the only variable—particle–wall friction coefficient (particle–
7 Applications: Pebble Flow Optimizations
Fig. 7.32 Sketch of pebble bed setup. a configuration of cylindrical pebble bed; b simulated 45 ◦
wedge bed
and dashpot model is generally accepted [3, 9]. For overcoming the stiffness problem, several different “artificial stiffness” values were tested to examine their effects
on results. For fuel pebbles in reactor core whose real Young’s modulus is larger than
1 GPa, values of Young’s modulus from 1.0 ×10
6 to 5.0 ×10
8 Pa were tested. As
the flow pattern of a very slow pebble flow is insensitive to this stiffness, Young’s
modulus with a value of 1.0 ×10
7 Pa is adopted. More details about the simulation
setup are listed in Table 7.6. Accuracy and applicability of DEM simulations on a
pebble flow have been validated by real experiments in published papers [1, 10].
7.5.2 Particle–Wall Friction
Particle–wall friction is the most crucial effect that can determine the flow pattern
in a specific pebble bed. In this section, a wide range of the particle–wall friction
coefficient from 0.01 to 0.6, which is difficult to realize in real experiments, has
been tested in the geometry mentioned above through simulations. Besides, some
conventional methods to study the pebble flow field are also introduced.
Making flow pattern features visible, the phenomenological method [1] usually
used in experiments is adopted here. The so-called phenomenological method is an
approach to study the dense pebble flow through investigating the interface features
of different areas composed of differently colored pebbles. Here, the pre-filled stripes
method, which is good at showing the vertical movements of pebbles, is utilized. A
series of cases with the only variable—particle–wall friction coefficient (particle–