

478
7 Applications: Pebble Flow Optimizations
⎧
⎪ ⎪ ⎪ ⎪ ⎪ ⎪ ⎨
⎪ ⎪ ⎪ ⎪ ⎪ ⎪ ⎩
x m =
1
N
N
i=0
x(t i )
T m =
1
N
N
i=0
t (x i )
v m =
1
N
N
i=0
v(x i )
where i = 0 : initial state when loaded;
i = N : final state when drained through the orifice
(7.10)
Thus, the radial distribution characteristics of the flow uniformity and the residence of time can be shown by the distribution of v m (x) and T m (x), respectively.
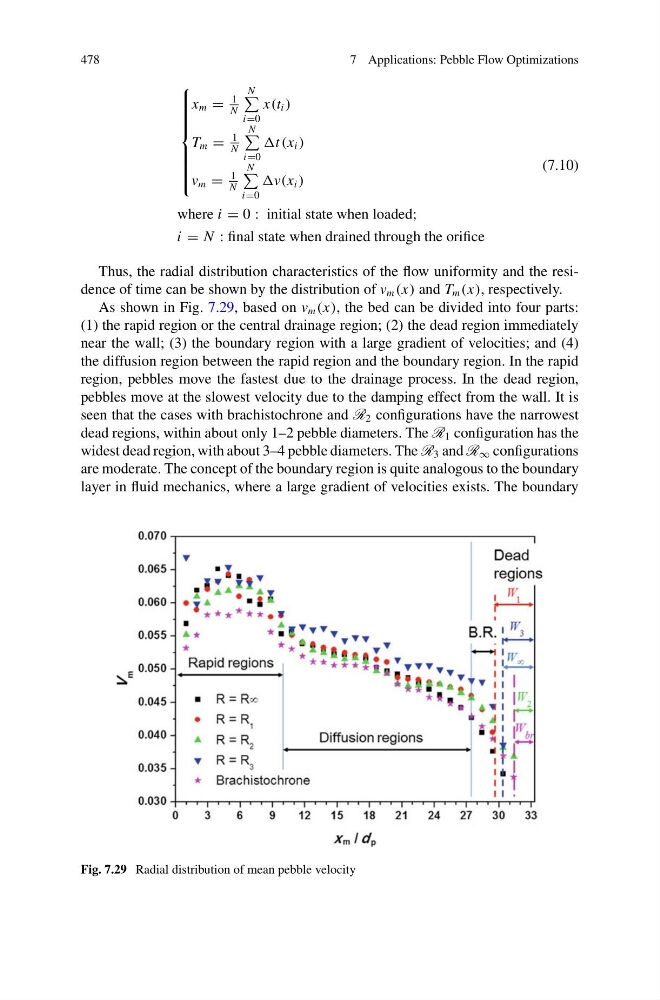
As shown in Fig. 7.29, based on v m (x), the bed can be divided into four parts:
(1) the rapid region or the central drainage region; (2) the dead region immediately
near the wall; (3) the boundary region with a large gradient of velocities; and (4)
the diffusion region between the rapid region and the boundary region. In the rapid
region, pebbles move the fastest due to the drainage process. In the dead region,
pebbles move at the slowest velocity due to the damping effect from the wall. It is
seen that the cases with brachistochrone and R 2 configurations have the narrowest
dead regions, within about only 1–2 pebble diameters. The R 1 configuration has the
widest dead region, with about 3–4 pebble diameters. The R 3 and R ∞ configurations
are moderate. The concept of the boundary region is quite analogous to the boundary
layer in fluid mechanics, where a large gradient of velocities exists. The boundary
Fig. 7.29 Radial distribution of mean pebble velocity
7 Applications: Pebble Flow Optimizations
⎧
⎪ ⎪ ⎪ ⎪ ⎪ ⎪ ⎨
⎪ ⎪ ⎪ ⎪ ⎪ ⎪ ⎩
x m =
1
N
N
i=0
x(t i )
T m =
1
N
N
i=0
t (x i )
v m =
1
N
N
i=0
v(x i )
where i = 0 : initial state when loaded;
i = N : final state when drained through the orifice
(7.10)
Thus, the radial distribution characteristics of the flow uniformity and the residence of time can be shown by the distribution of v m (x) and T m (x), respectively.
As shown in Fig. 7.29, based on v m (x), the bed can be divided into four parts:
(1) the rapid region or the central drainage region; (2) the dead region immediately
near the wall; (3) the boundary region with a large gradient of velocities; and (4)
the diffusion region between the rapid region and the boundary region. In the rapid
region, pebbles move the fastest due to the drainage process. In the dead region,
pebbles move at the slowest velocity due to the damping effect from the wall. It is
seen that the cases with brachistochrone and R 2 configurations have the narrowest
dead regions, within about only 1–2 pebble diameters. The R 1 configuration has the
widest dead region, with about 3–4 pebble diameters. The R 3 and R ∞ configurations
are moderate. The concept of the boundary region is quite analogous to the boundary
layer in fluid mechanics, where a large gradient of velocities exists. The boundary
Fig. 7.29 Radial distribution of mean pebble velocity