

7.4 Conical Base Optimization
477
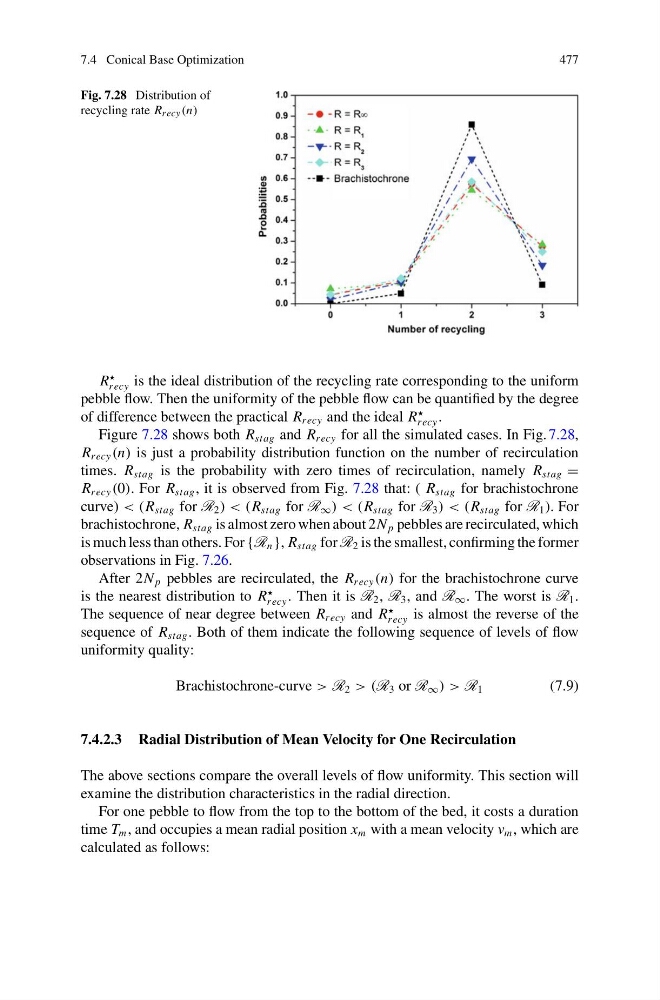
Fig. 7.28 Distribution of
recycling rate R recy (n)
R
recy is the ideal distribution of the recycling rate corresponding to the uniform
pebble flow. Then the uniformity of the pebble flow can be quantified by the degree
of difference between the practical R recy and the ideal R
recy .
Figure 7.28 shows both R stag and R recy for all the simulated cases. In Fig. 7.28,
R recy (n) is just a probability distribution function on the number of recirculation
times. R stag is the probability with zero times of recirculation, namely R stag =
R recy (0). For R stag , it is observed from Fig. 7.28 that: ( R stag for brachistochrone
curve) < (R stag for R 2 ) < (R stag for R ∞ ) < (R stag for R 3 ) < (R stag for R 1 ). For
brachistochrone, R stag is almost zero when about 2N p pebbles are recirculated, which
is much less than others. For {R n }, R stag for R 2 is the smallest, confirming the former
observations in Fig. 7.26.
After 2N p pebbles are recirculated, the R recy (n) for the brachistochrone curve
is the nearest distribution to R
recy . Then it is R 2 , R 3 , and R ∞ . The worst is R 1 .
The sequence of near degree between R recy and R
recy is almost the reverse of the
sequence of R stag . Both of them indicate the following sequence of levels of flow
uniformity quality:
Brachistochrone-curve > R 2 > (R 3 or R ∞ ) > R 1
(7.9)
7.4.2.3 Radial Distribution of Mean Velocity for One Recirculation
The above sections compare the overall levels of flow uniformity. This section will
examine the distribution characteristics in the radial direction.
For one pebble to flow from the top to the bottom of the bed, it costs a duration
time T m , and occupies a mean radial position x m with a mean velocity v m , which are
calculated as follows:
477
Fig. 7.28 Distribution of
recycling rate R recy (n)
R
recy is the ideal distribution of the recycling rate corresponding to the uniform
pebble flow. Then the uniformity of the pebble flow can be quantified by the degree
of difference between the practical R recy and the ideal R
recy .
Figure 7.28 shows both R stag and R recy for all the simulated cases. In Fig. 7.28,
R recy (n) is just a probability distribution function on the number of recirculation
times. R stag is the probability with zero times of recirculation, namely R stag =
R recy (0). For R stag , it is observed from Fig. 7.28 that: ( R stag for brachistochrone
curve) < (R stag for R 2 ) < (R stag for R ∞ ) < (R stag for R 3 ) < (R stag for R 1 ). For
brachistochrone, R stag is almost zero when about 2N p pebbles are recirculated, which
is much less than others. For {R n }, R stag for R 2 is the smallest, confirming the former
observations in Fig. 7.26.
After 2N p pebbles are recirculated, the R recy (n) for the brachistochrone curve
is the nearest distribution to R
recy . Then it is R 2 , R 3 , and R ∞ . The worst is R 1 .
The sequence of near degree between R recy and R
recy is almost the reverse of the
sequence of R stag . Both of them indicate the following sequence of levels of flow
uniformity quality:
Brachistochrone-curve > R 2 > (R 3 or R ∞ ) > R 1
(7.9)
7.4.2.3 Radial Distribution of Mean Velocity for One Recirculation
The above sections compare the overall levels of flow uniformity. This section will
examine the distribution characteristics in the radial direction.
For one pebble to flow from the top to the bottom of the bed, it costs a duration
time T m , and occupies a mean radial position x m with a mean velocity v m , which are
calculated as follows: