

462
7 Applications: Pebble Flow Optimizations
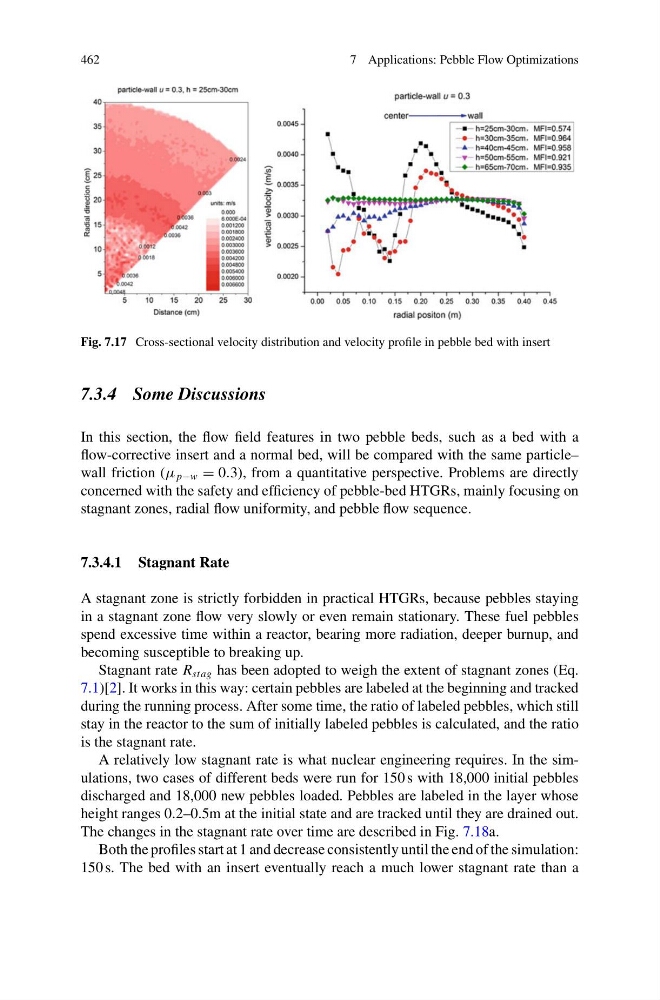
Fig. 7.17 Cross-sectional velocity distribution and velocity profile in pebble bed with insert
7.3.4 Some Discussions
In this section, the flow field features in two pebble beds, such as a bed with a
flow-corrective insert and a normal bed, will be compared with the same particle–
wall friction (μ p−w = 0.3), from a quantitative perspective. Problems are directly
concerned with the safety and efficiency of pebble-bed HTGRs, mainly focusing on
stagnant zones, radial flow uniformity, and pebble flow sequence.
7.3.4.1 Stagnant Rate
A stagnant zone is strictly forbidden in practical HTGRs, because pebbles staying
in a stagnant zone flow very slowly or even remain stationary. These fuel pebbles
spend excessive time within a reactor, bearing more radiation, deeper burnup, and
becoming susceptible to breaking up.
Stagnant rate R stag has been adopted to weigh the extent of stagnant zones (Eq.
7.1)[2]. It works in this way: certain pebbles are labeled at the beginning and tracked
during the running process. After some time, the ratio of labeled pebbles, which still
stay in the reactor to the sum of initially labeled pebbles is calculated, and the ratio
is the stagnant rate.
A relatively low stagnant rate is what nuclear engineering requires. In the simulations, two cases of different beds were run for 150 s with 18,000 initial pebbles
discharged and 18,000 new pebbles loaded. Pebbles are labeled in the layer whose
height ranges 0.2–0.5m at the initial state and are tracked until they are drained out.
The changes in the stagnant rate over time are described in Fig. 7.18a.
Both the profiles start at 1 and decrease consistently until the end of the simulation:
150 s. The bed with an insert eventually reach a much lower stagnant rate than a
7 Applications: Pebble Flow Optimizations
Fig. 7.17 Cross-sectional velocity distribution and velocity profile in pebble bed with insert
7.3.4 Some Discussions
In this section, the flow field features in two pebble beds, such as a bed with a
flow-corrective insert and a normal bed, will be compared with the same particle–
wall friction (μ p−w = 0.3), from a quantitative perspective. Problems are directly
concerned with the safety and efficiency of pebble-bed HTGRs, mainly focusing on
stagnant zones, radial flow uniformity, and pebble flow sequence.
7.3.4.1 Stagnant Rate
A stagnant zone is strictly forbidden in practical HTGRs, because pebbles staying
in a stagnant zone flow very slowly or even remain stationary. These fuel pebbles
spend excessive time within a reactor, bearing more radiation, deeper burnup, and
becoming susceptible to breaking up.
Stagnant rate R stag has been adopted to weigh the extent of stagnant zones (Eq.
7.1)[2]. It works in this way: certain pebbles are labeled at the beginning and tracked
during the running process. After some time, the ratio of labeled pebbles, which still
stay in the reactor to the sum of initially labeled pebbles is calculated, and the ratio
is the stagnant rate.
A relatively low stagnant rate is what nuclear engineering requires. In the simulations, two cases of different beds were run for 150 s with 18,000 initial pebbles
discharged and 18,000 new pebbles loaded. Pebbles are labeled in the layer whose
height ranges 0.2–0.5m at the initial state and are tracked until they are drained out.
The changes in the stagnant rate over time are described in Fig. 7.18a.
Both the profiles start at 1 and decrease consistently until the end of the simulation:
150 s. The bed with an insert eventually reach a much lower stagnant rate than a