

458
7 Applications: Pebble Flow Optimizations
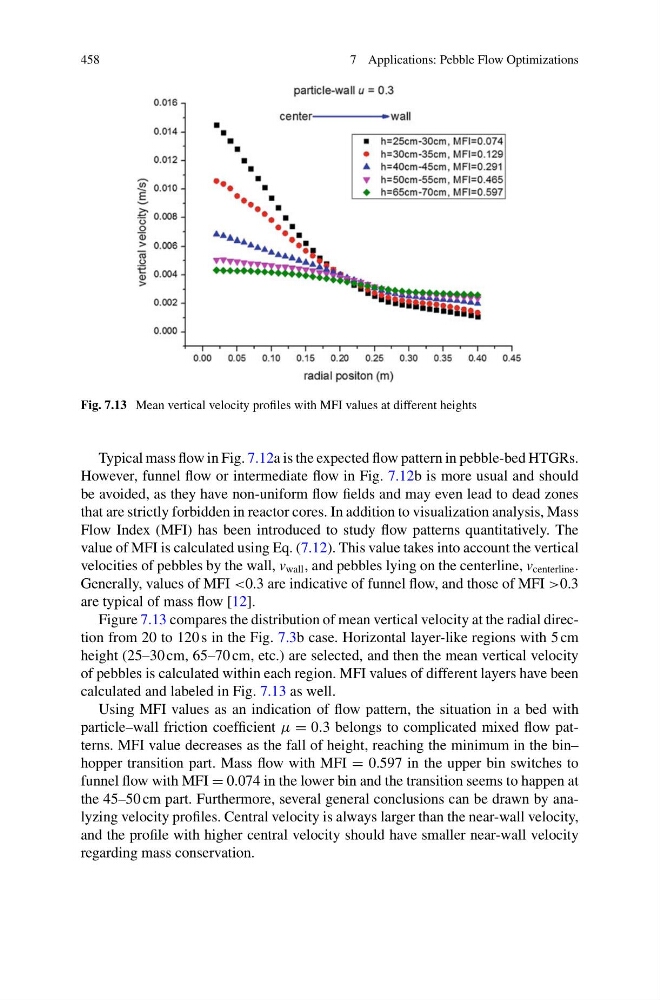
Fig. 7.13 Mean vertical velocity profiles with MFI values at different heights
Typical mass flow in Fig. 7.12a is the expected flow pattern in pebble-bed HTGRs.
However, funnel flow or intermediate flow in Fig. 7.12b is more usual and should
be avoided, as they have non-uniform flow fields and may even lead to dead zones
that are strictly forbidden in reactor cores. In addition to visualization analysis, Mass
Flow Index (MFI) has been introduced to study flow patterns quantitatively. The
value of MFI is calculated using Eq. (7.12). This value takes into account the vertical
velocities of pebbles by the wall, v wall , and pebbles lying on the centerline, v centerline .
Generally, values of MFI <0.3 are indicative of funnel flow, and those of MFI >0.3
are typical of mass flow [12].
Figure 7.13 compares the distribution of mean vertical velocity at the radial direction from 20 to 120 s in the Fig. 7.3b case. Horizontal layer-like regions with 5 cm
height (25–30 cm, 65–70 cm, etc.) are selected, and then the mean vertical velocity
of pebbles is calculated within each region. MFI values of different layers have been
calculated and labeled in Fig. 7.13 as well.
Using MFI values as an indication of flow pattern, the situation in a bed with
particle–wall friction coefficient μ = 0.3 belongs to complicated mixed flow patterns. MFI value decreases as the fall of height, reaching the minimum in the bin–
hopper transition part. Mass flow with MFI = 0.597 in the upper bin switches to
funnel flow with MFI = 0.074 in the lower bin and the transition seems to happen at
the 45–50 cm part. Furthermore, several general conclusions can be drawn by analyzing velocity profiles. Central velocity is always larger than the near-wall velocity,
and the profile with higher central velocity should have smaller near-wall velocity
regarding mass conservation.
7 Applications: Pebble Flow Optimizations
Fig. 7.13 Mean vertical velocity profiles with MFI values at different heights
Typical mass flow in Fig. 7.12a is the expected flow pattern in pebble-bed HTGRs.
However, funnel flow or intermediate flow in Fig. 7.12b is more usual and should
be avoided, as they have non-uniform flow fields and may even lead to dead zones
that are strictly forbidden in reactor cores. In addition to visualization analysis, Mass
Flow Index (MFI) has been introduced to study flow patterns quantitatively. The
value of MFI is calculated using Eq. (7.12). This value takes into account the vertical
velocities of pebbles by the wall, v wall , and pebbles lying on the centerline, v centerline .
Generally, values of MFI <0.3 are indicative of funnel flow, and those of MFI >0.3
are typical of mass flow [12].
Figure 7.13 compares the distribution of mean vertical velocity at the radial direction from 20 to 120 s in the Fig. 7.3b case. Horizontal layer-like regions with 5 cm
height (25–30 cm, 65–70 cm, etc.) are selected, and then the mean vertical velocity
of pebbles is calculated within each region. MFI values of different layers have been
calculated and labeled in Fig. 7.13 as well.
Using MFI values as an indication of flow pattern, the situation in a bed with
particle–wall friction coefficient μ = 0.3 belongs to complicated mixed flow patterns. MFI value decreases as the fall of height, reaching the minimum in the bin–
hopper transition part. Mass flow with MFI = 0.597 in the upper bin switches to
funnel flow with MFI = 0.074 in the lower bin and the transition seems to happen at
the 45–50 cm part. Furthermore, several general conclusions can be drawn by analyzing velocity profiles. Central velocity is always larger than the near-wall velocity,
and the profile with higher central velocity should have smaller near-wall velocity
regarding mass conservation.