

7.3 Flow-Corrective Insert Optimization
457
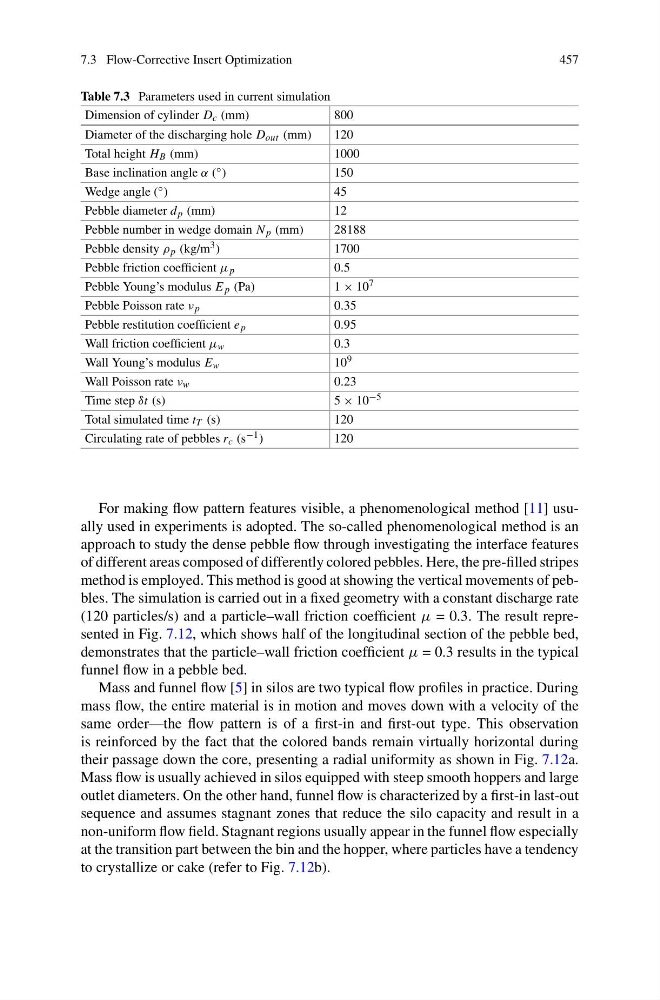
Table 7.3 Parameters used in current simulation
Dimension of cylinder D c (mm)
800
Diameter of the discharging hole D out (mm)
120
Total height H B (mm)
1000
Base inclination angle α ( ◦ )
150
Wedge angle ( ◦ )
45
Pebble diameter d p (mm)
12
Pebble number in wedge domain N p (mm)
28188
Pebble density ρ p (kg/m 3 )
1700
Pebble friction coefficient μ p
0.5
Pebble Young’s modulus E p (Pa)
1 × 10 7
Pebble Poisson rate ν p
0.35
Pebble restitution coefficient e p
0.95
Wall friction coefficient μ w
0.3
Wall Young’s modulus E w
10 9
Wall Poisson rate ν w
0.23
Time step δt (s)
5 × 10 −5
Total simulated time t T (s)
120
Circulating rate of pebbles r c (s −1 )
120
For making flow pattern features visible, a phenomenological method [11] usually used in experiments is adopted. The so-called phenomenological method is an
approach to study the dense pebble flow through investigating the interface features
of different areas composed of differently colored pebbles. Here, the pre-filled stripes
method is employed. This method is good at showing the vertical movements of pebbles. The simulation is carried out in a fixed geometry with a constant discharge rate
(120 particles/s) and a particle–wall friction coefficient μ = 0.3. The result represented in Fig. 7.12, which shows half of the longitudinal section of the pebble bed,
demonstrates that the particle–wall friction coefficient μ = 0.3 results in the typical
funnel flow in a pebble bed.
Mass and funnel flow [5] in silos are two typical flow profiles in practice. During
mass flow, the entire material is in motion and moves down with a velocity of the
same order—the flow pattern is of a first-in and first-out type. This observation
is reinforced by the fact that the colored bands remain virtually horizontal during
their passage down the core, presenting a radial uniformity as shown in Fig. 7.12a.
Mass flow is usually achieved in silos equipped with steep smooth hoppers and large
outlet diameters. On the other hand, funnel flow is characterized by a first-in last-out
sequence and assumes stagnant zones that reduce the silo capacity and result in a
non-uniform flow field. Stagnant regions usually appear in the funnel flow especially
at the transition part between the bin and the hopper, where particles have a tendency
to crystallize or cake (refer to Fig. 7.12b).
457
Table 7.3 Parameters used in current simulation
Dimension of cylinder D c (mm)
800
Diameter of the discharging hole D out (mm)
120
Total height H B (mm)
1000
Base inclination angle α ( ◦ )
150
Wedge angle ( ◦ )
45
Pebble diameter d p (mm)
12
Pebble number in wedge domain N p (mm)
28188
Pebble density ρ p (kg/m 3 )
1700
Pebble friction coefficient μ p
0.5
Pebble Young’s modulus E p (Pa)
1 × 10 7
Pebble Poisson rate ν p
0.35
Pebble restitution coefficient e p
0.95
Wall friction coefficient μ w
0.3
Wall Young’s modulus E w
10 9
Wall Poisson rate ν w
0.23
Time step δt (s)
5 × 10 −5
Total simulated time t T (s)
120
Circulating rate of pebbles r c (s −1 )
120
For making flow pattern features visible, a phenomenological method [11] usually used in experiments is adopted. The so-called phenomenological method is an
approach to study the dense pebble flow through investigating the interface features
of different areas composed of differently colored pebbles. Here, the pre-filled stripes
method is employed. This method is good at showing the vertical movements of pebbles. The simulation is carried out in a fixed geometry with a constant discharge rate
(120 particles/s) and a particle–wall friction coefficient μ = 0.3. The result represented in Fig. 7.12, which shows half of the longitudinal section of the pebble bed,
demonstrates that the particle–wall friction coefficient μ = 0.3 results in the typical
funnel flow in a pebble bed.
Mass and funnel flow [5] in silos are two typical flow profiles in practice. During
mass flow, the entire material is in motion and moves down with a velocity of the
same order—the flow pattern is of a first-in and first-out type. This observation
is reinforced by the fact that the colored bands remain virtually horizontal during
their passage down the core, presenting a radial uniformity as shown in Fig. 7.12a.
Mass flow is usually achieved in silos equipped with steep smooth hoppers and large
outlet diameters. On the other hand, funnel flow is characterized by a first-in last-out
sequence and assumes stagnant zones that reduce the silo capacity and result in a
non-uniform flow field. Stagnant regions usually appear in the funnel flow especially
at the transition part between the bin and the hopper, where particles have a tendency
to crystallize or cake (refer to Fig. 7.12b).