

428
6 Applications: Two-Region Pebble Beds
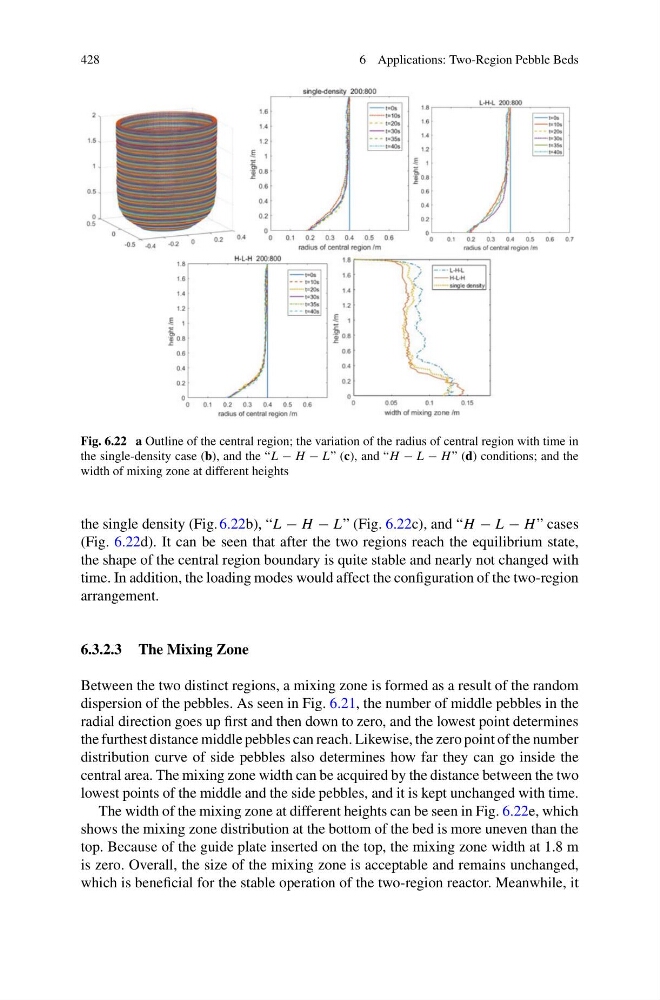
Fig. 6.22 a Outline of the central region; the variation of the radius of central region with time in
the single-density case (b), and the “L − H − L” (c), and “H − L − H ” (d) conditions; and the
width of mixing zone at different heights
the single density (Fig. 6.22b), “L − H − L” (Fig. 6.22c), and “H − L − H ” cases
(Fig. 6.22d). It can be seen that after the two regions reach the equilibrium state,
the shape of the central region boundary is quite stable and nearly not changed with
time. In addition, the loading modes would affect the configuration of the two-region
arrangement.
6.3.2.3 The Mixing Zone
Between the two distinct regions, a mixing zone is formed as a result of the random
dispersion of the pebbles. As seen in Fig. 6.21, the number of middle pebbles in the
radial direction goes up first and then down to zero, and the lowest point determines
the furthest distance middle pebbles can reach. Likewise, the zero point of the number
distribution curve of side pebbles also determines how far they can go inside the
central area. The mixing zone width can be acquired by the distance between the two
lowest points of the middle and the side pebbles, and it is kept unchanged with time.
The width of the mixing zone at different heights can be seen in Fig. 6.22e, which
shows the mixing zone distribution at the bottom of the bed is more uneven than the
top. Because of the guide plate inserted on the top, the mixing zone width at 1.8 m
is zero. Overall, the size of the mixing zone is acceptable and remains unchanged,
which is beneficial for the stable operation of the two-region reactor. Meanwhile, it
6 Applications: Two-Region Pebble Beds
Fig. 6.22 a Outline of the central region; the variation of the radius of central region with time in
the single-density case (b), and the “L − H − L” (c), and “H − L − H ” (d) conditions; and the
width of mixing zone at different heights
the single density (Fig. 6.22b), “L − H − L” (Fig. 6.22c), and “H − L − H ” cases
(Fig. 6.22d). It can be seen that after the two regions reach the equilibrium state,
the shape of the central region boundary is quite stable and nearly not changed with
time. In addition, the loading modes would affect the configuration of the two-region
arrangement.
6.3.2.3 The Mixing Zone
Between the two distinct regions, a mixing zone is formed as a result of the random
dispersion of the pebbles. As seen in Fig. 6.21, the number of middle pebbles in the
radial direction goes up first and then down to zero, and the lowest point determines
the furthest distance middle pebbles can reach. Likewise, the zero point of the number
distribution curve of side pebbles also determines how far they can go inside the
central area. The mixing zone width can be acquired by the distance between the two
lowest points of the middle and the side pebbles, and it is kept unchanged with time.
The width of the mixing zone at different heights can be seen in Fig. 6.22e, which
shows the mixing zone distribution at the bottom of the bed is more uneven than the
top. Because of the guide plate inserted on the top, the mixing zone width at 1.8 m
is zero. Overall, the size of the mixing zone is acceptable and remains unchanged,
which is beneficial for the stable operation of the two-region reactor. Meanwhile, it