

5.4 CFD-DEM Coupled Simulation and Development
343
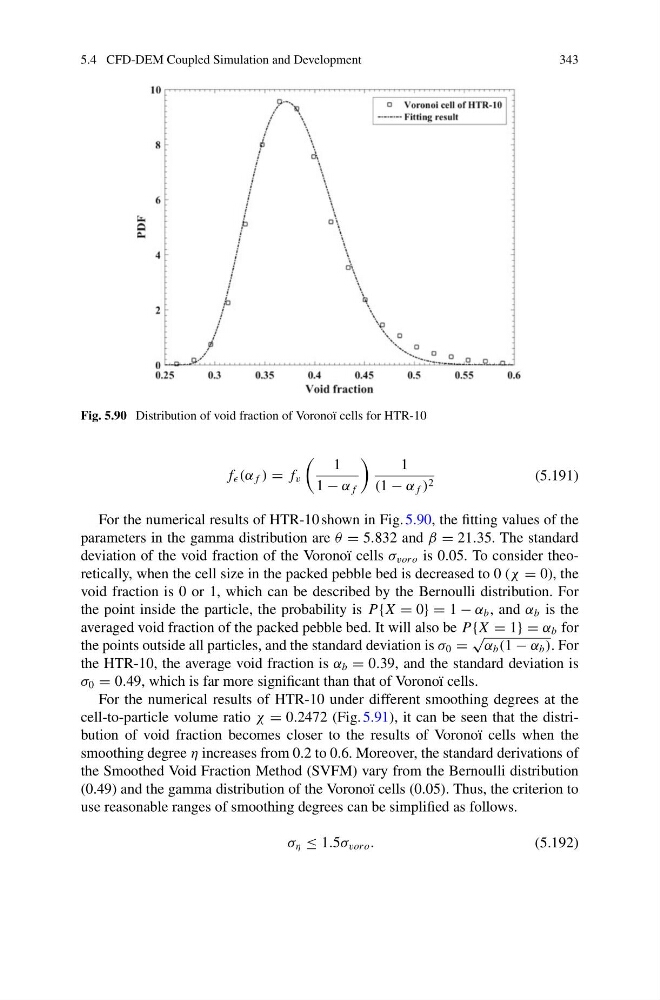
Fig. 5.90 Distribution of void fraction of Voronoï cells for HTR-10
f (α f ) = f v
1
1 − α f
1
(1 − α f ) 2
(5.191)
For the numerical results of HTR-10 shown in Fig. 5.90, the fitting values of the
parameters in the gamma distribution are θ = 5.832 and β = 21.35. The standard
deviation of the void fraction of the Voronoï cells σ vor o is 0.05. To consider theoretically, when the cell size in the packed pebble bed is decreased to 0 (χ = 0), the
void fraction is 0 or 1, which can be described by the Bernoulli distribution. For
the point inside the particle, the probability is P{X = 0} = 1 − α b , and α b is the
averaged void fraction of the packed pebble bed. It will also be P{X = 1} = α b for
the points outside all particles, and the standard deviation is σ 0 =
√
α b (1 − α b ). For
the HTR-10, the average void fraction is α b = 0.39, and the standard deviation is
σ 0 = 0.49, which is far more significant than that of Voronoï cells.
For the numerical results of HTR-10 under different smoothing degrees at the
cell-to-particle volume ratio χ = 0.2472 (Fig. 5.91), it can be seen that the distribution of void fraction becomes closer to the results of Voronoï cells when the
smoothing degree η increases from 0.2 to 0.6. Moreover, the standard derivations of
the Smoothed Void Fraction Method (SVFM) vary from the Bernoulli distribution
(0.49) and the gamma distribution of the Voronoï cells (0.05). Thus, the criterion to
use reasonable ranges of smoothing degrees can be simplified as follows.
σ η ≤ 1.5σ vor o .
(5.192)
343
Fig. 5.90 Distribution of void fraction of Voronoï cells for HTR-10
f (α f ) = f v
1
1 − α f
1
(1 − α f ) 2
(5.191)
For the numerical results of HTR-10 shown in Fig. 5.90, the fitting values of the
parameters in the gamma distribution are θ = 5.832 and β = 21.35. The standard
deviation of the void fraction of the Voronoï cells σ vor o is 0.05. To consider theoretically, when the cell size in the packed pebble bed is decreased to 0 (χ = 0), the
void fraction is 0 or 1, which can be described by the Bernoulli distribution. For
the point inside the particle, the probability is P{X = 0} = 1 − α b , and α b is the
averaged void fraction of the packed pebble bed. It will also be P{X = 1} = α b for
the points outside all particles, and the standard deviation is σ 0 =
√
α b (1 − α b ). For
the HTR-10, the average void fraction is α b = 0.39, and the standard deviation is
σ 0 = 0.49, which is far more significant than that of Voronoï cells.
For the numerical results of HTR-10 under different smoothing degrees at the
cell-to-particle volume ratio χ = 0.2472 (Fig. 5.91), it can be seen that the distribution of void fraction becomes closer to the results of Voronoï cells when the
smoothing degree η increases from 0.2 to 0.6. Moreover, the standard derivations of
the Smoothed Void Fraction Method (SVFM) vary from the Bernoulli distribution
(0.49) and the gamma distribution of the Voronoï cells (0.05). Thus, the criterion to
use reasonable ranges of smoothing degrees can be simplified as follows.
σ η ≤ 1.5σ vor o .
(5.192)