

5.4 CFD-DEM Coupled Simulation and Development
315
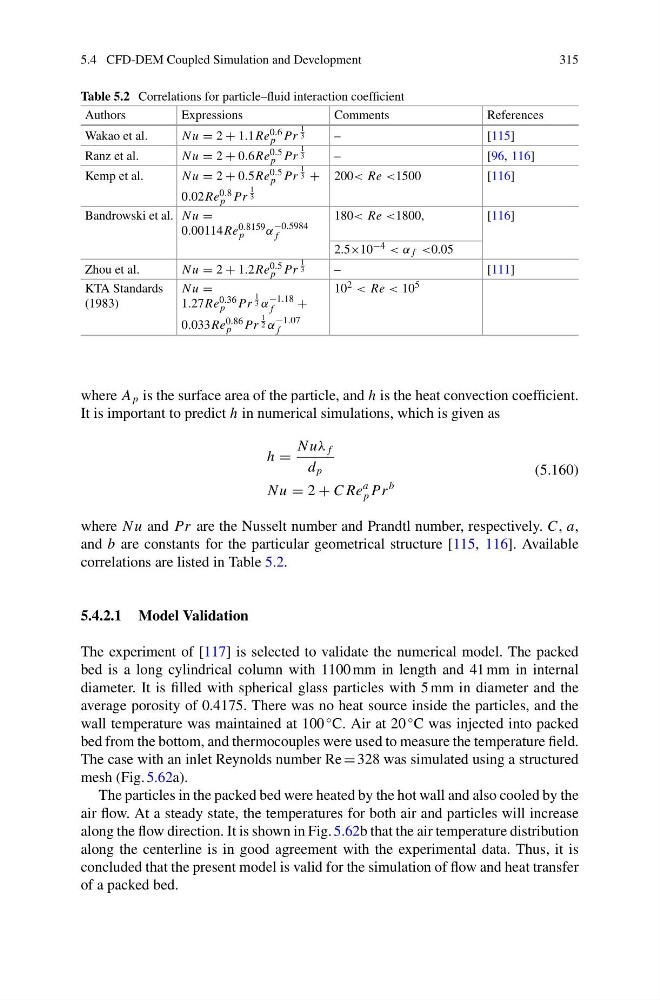
Table 5.2 Correlations for particle–fluid interaction coefficient
Authors
Expressions
Comments
References
Wakao et al.
N u = 2 + 1.1Re 0.6
p Pr
1
3
–
[115]
Ranz et al.
N u = 2 + 0.6Re 0.5
p Pr
1
3
–
[96, 116]
Kemp et al.
N u = 2 + 0.5Re 0.5
p Pr
1
3 +
0.02Re 0.8
p Pr
1
3
200< Re <1500
[116]
Bandrowski et al. N u =
0.00114Re 0.8159
p
α
−0.5984
f
180< Re <1800,
[116]
2.5×10 −4 < α f <0.05
Zhou et al.
N u = 2 + 1.2Re 0.5
p Pr
1
3
–
[111]
KTA Standards
(1983)
N u =
1.27Re 0.36
p Pr
1
3 α
−1.18
f
+
0.033Re 0.86
p Pr
1
2 α
−1.07
f
10 2 < Re < 10 5
where A p is the surface area of the particle, and h is the heat convection coefficient.
It is important to predict h in numerical simulations, which is given as
h =
N uλ f
d p
N u = 2 + C Re
a
p Pr
b
(5.160)
where N u and Pr are the Nusselt number and Prandtl number, respectively. C, a,
and b are constants for the particular geometrical structure [115, 116]. Available
correlations are listed in Table 5.2.
5.4.2.1 Model Validation
The experiment of [117] is selected to validate the numerical model. The packed
bed is a long cylindrical column with 1100 mm in length and 41 mm in internal
diameter. It is filled with spherical glass particles with 5 mm in diameter and the
average porosity of 0.4175. There was no heat source inside the particles, and the
wall temperature was maintained at 100
◦ C. Air at 20
◦ C was injected into packed
bed from the bottom, and thermocouples were used to measure the temperature field.
The case with an inlet Reynolds number Re = 328 was simulated using a structured
mesh (Fig. 5.62a).
The particles in the packed bed were heated by the hot wall and also cooled by the
air flow. At a steady state, the temperatures for both air and particles will increase
along the flow direction. It is shown in Fig. 5.62b that the air temperature distribution
along the centerline is in good agreement with the experimental data. Thus, it is
concluded that the present model is valid for the simulation of flow and heat transfer
of a packed bed.
315
Table 5.2 Correlations for particle–fluid interaction coefficient
Authors
Expressions
Comments
References
Wakao et al.
N u = 2 + 1.1Re 0.6
p Pr
1
3
–
[115]
Ranz et al.
N u = 2 + 0.6Re 0.5
p Pr
1
3
–
[96, 116]
Kemp et al.
N u = 2 + 0.5Re 0.5
p Pr
1
3 +
0.02Re 0.8
p Pr
1
3
200< Re <1500
[116]
Bandrowski et al. N u =
0.00114Re 0.8159
p
α
−0.5984
f
180< Re <1800,
[116]
2.5×10 −4 < α f <0.05
Zhou et al.
N u = 2 + 1.2Re 0.5
p Pr
1
3
–
[111]
KTA Standards
(1983)
N u =
1.27Re 0.36
p Pr
1
3 α
−1.18
f
+
0.033Re 0.86
p Pr
1
2 α
−1.07
f
10 2 < Re < 10 5
where A p is the surface area of the particle, and h is the heat convection coefficient.
It is important to predict h in numerical simulations, which is given as
h =
N uλ f
d p
N u = 2 + C Re
a
p Pr
b
(5.160)
where N u and Pr are the Nusselt number and Prandtl number, respectively. C, a,
and b are constants for the particular geometrical structure [115, 116]. Available
correlations are listed in Table 5.2.
5.4.2.1 Model Validation
The experiment of [117] is selected to validate the numerical model. The packed
bed is a long cylindrical column with 1100 mm in length and 41 mm in internal
diameter. It is filled with spherical glass particles with 5 mm in diameter and the
average porosity of 0.4175. There was no heat source inside the particles, and the
wall temperature was maintained at 100
◦ C. Air at 20
◦ C was injected into packed
bed from the bottom, and thermocouples were used to measure the temperature field.
The case with an inlet Reynolds number Re = 328 was simulated using a structured
mesh (Fig. 5.62a).
The particles in the packed bed were heated by the hot wall and also cooled by the
air flow. At a steady state, the temperatures for both air and particles will increase
along the flow direction. It is shown in Fig. 5.62b that the air temperature distribution
along the centerline is in good agreement with the experimental data. Thus, it is
concluded that the present model is valid for the simulation of flow and heat transfer
of a packed bed.