

270
5 Numerical Models for Pebble-Bed Heat Transfer
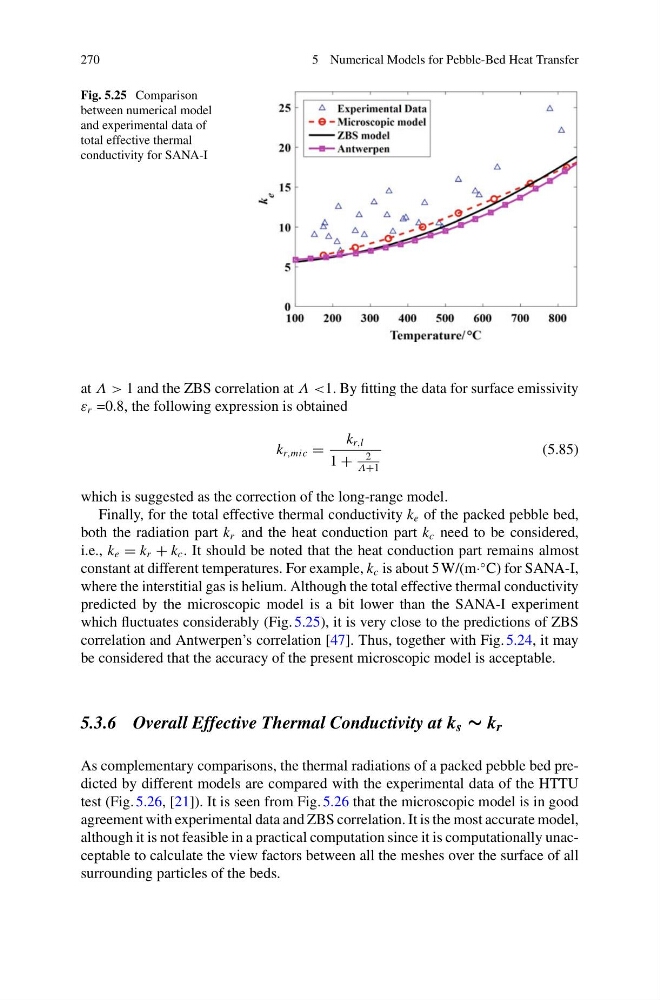
Fig. 5.25 Comparison
between numerical model
and experimental data of
total effective thermal
conductivity for SANA-I
at Λ > 1 and the ZBS correlation at Λ <1. By fitting the data for surface emissivity
ε r =0.8, the following expression is obtained
k r,mic =
k r,l
1 +
2
Λ+1
(5.85)
which is suggested as the correction of the long-range model.
Finally, for the total effective thermal conductivity k e of the packed pebble bed,
both the radiation part k r and the heat conduction part k c need to be considered,
i.e., k e = k r + k c . It should be noted that the heat conduction part remains almost
constant at different temperatures. For example, k c is about 5 W/(m·
◦ C) for SANA-I,
where the interstitial gas is helium. Although the total effective thermal conductivity
predicted by the microscopic model is a bit lower than the SANA-I experiment
which fluctuates considerably (Fig. 5.25), it is very close to the predictions of ZBS
correlation and Antwerpen’s correlation [47]. Thus, together with Fig. 5.24, it may
be considered that the accuracy of the present microscopic model is acceptable.
5.3.6 Overall Effective Thermal Conductivity at k s ∼ k r
As complementary comparisons, the thermal radiations of a packed pebble bed predicted by different models are compared with the experimental data of the HTTU
test (Fig. 5.26, [21]). It is seen from Fig. 5.26 that the microscopic model is in good
agreement with experimental data and ZBS correlation. It is the most accurate model,
although it is not feasible in a practical computation since it is computationally unacceptable to calculate the view factors between all the meshes over the surface of all
surrounding particles of the beds.
5 Numerical Models for Pebble-Bed Heat Transfer
Fig. 5.25 Comparison
between numerical model
and experimental data of
total effective thermal
conductivity for SANA-I
at Λ > 1 and the ZBS correlation at Λ <1. By fitting the data for surface emissivity
ε r =0.8, the following expression is obtained
k r,mic =
k r,l
1 +
2
Λ+1
(5.85)
which is suggested as the correction of the long-range model.
Finally, for the total effective thermal conductivity k e of the packed pebble bed,
both the radiation part k r and the heat conduction part k c need to be considered,
i.e., k e = k r + k c . It should be noted that the heat conduction part remains almost
constant at different temperatures. For example, k c is about 5 W/(m·
◦ C) for SANA-I,
where the interstitial gas is helium. Although the total effective thermal conductivity
predicted by the microscopic model is a bit lower than the SANA-I experiment
which fluctuates considerably (Fig. 5.25), it is very close to the predictions of ZBS
correlation and Antwerpen’s correlation [47]. Thus, together with Fig. 5.24, it may
be considered that the accuracy of the present microscopic model is acceptable.
5.3.6 Overall Effective Thermal Conductivity at k s ∼ k r
As complementary comparisons, the thermal radiations of a packed pebble bed predicted by different models are compared with the experimental data of the HTTU
test (Fig. 5.26, [21]). It is seen from Fig. 5.26 that the microscopic model is in good
agreement with experimental data and ZBS correlation. It is the most accurate model,
although it is not feasible in a practical computation since it is computationally unacceptable to calculate the view factors between all the meshes over the surface of all
surrounding particles of the beds.