

4.3 Three-Dimensional Pebble Flow
227
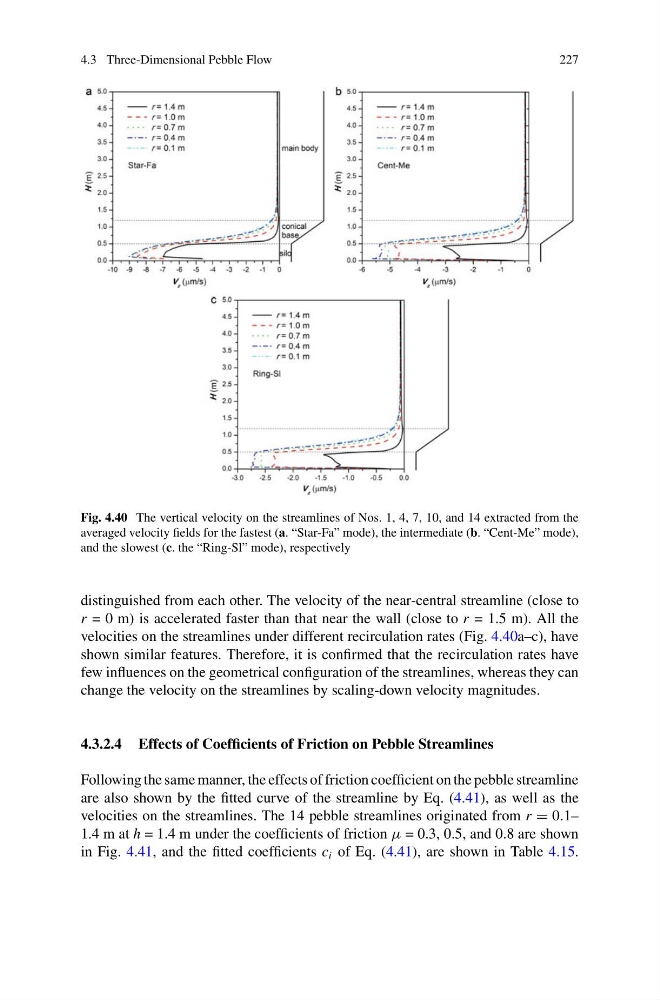
Fig. 4.40 The vertical velocity on the streamlines of Nos. 1, 4, 7, 10, and 14 extracted from the
averaged velocity fields for the fastest (a. “Star-Fa” mode), the intermediate (b. “Cent-Me” mode),
and the slowest (c. the “Ring-Sl” mode), respectively
distinguished from each other. The velocity of the near-central streamline (close to
r = 0 m) is accelerated faster than that near the wall (close to r = 1.5 m). All the
velocities on the streamlines under different recirculation rates (Fig. 4.40a–c), have
shown similar features. Therefore, it is confirmed that the recirculation rates have
few influences on the geometrical configuration of the streamlines, whereas they can
change the velocity on the streamlines by scaling-down velocity magnitudes.
4.3.2.4 Effects of Coefficients of Friction on Pebble Streamlines
Following the same manner, the effects of friction coefficient on the pebble streamline
are also shown by the fitted curve of the streamline by Eq. (4.41), as well as the
velocities on the streamlines. The 14 pebble streamlines originated from r = 0.1–
1.4 m at h = 1.4 m under the coefficients of friction μ = 0.3, 0.5, and 0.8 are shown
in Fig. 4.41, and the fitted coefficients c i of Eq. (4.41), are shown in Table 4.15.
227
Fig. 4.40 The vertical velocity on the streamlines of Nos. 1, 4, 7, 10, and 14 extracted from the
averaged velocity fields for the fastest (a. “Star-Fa” mode), the intermediate (b. “Cent-Me” mode),
and the slowest (c. the “Ring-Sl” mode), respectively
distinguished from each other. The velocity of the near-central streamline (close to
r = 0 m) is accelerated faster than that near the wall (close to r = 1.5 m). All the
velocities on the streamlines under different recirculation rates (Fig. 4.40a–c), have
shown similar features. Therefore, it is confirmed that the recirculation rates have
few influences on the geometrical configuration of the streamlines, whereas they can
change the velocity on the streamlines by scaling-down velocity magnitudes.
4.3.2.4 Effects of Coefficients of Friction on Pebble Streamlines
Following the same manner, the effects of friction coefficient on the pebble streamline
are also shown by the fitted curve of the streamline by Eq. (4.41), as well as the
velocities on the streamlines. The 14 pebble streamlines originated from r = 0.1–
1.4 m at h = 1.4 m under the coefficients of friction μ = 0.3, 0.5, and 0.8 are shown
in Fig. 4.41, and the fitted coefficients c i of Eq. (4.41), are shown in Table 4.15.