

2.5 Particle Velocimetry Measurements
109
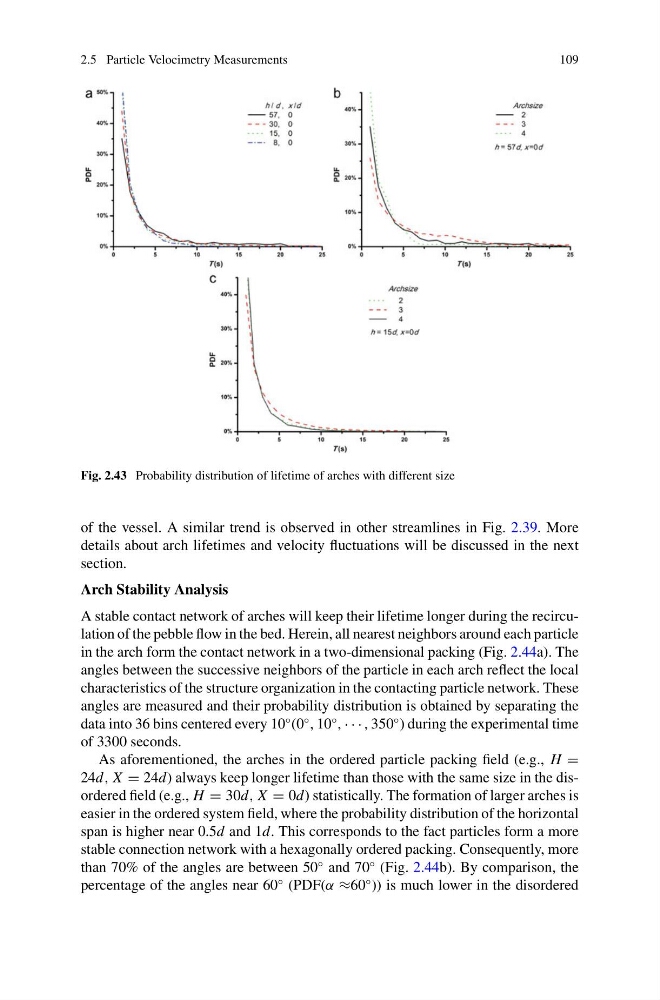
Fig. 2.43 Probability distribution of lifetime of arches with different size
of the vessel. A similar trend is observed in other streamlines in Fig. 2.39. More
details about arch lifetimes and velocity fluctuations will be discussed in the next
section.
Arch Stability Analysis
A stable contact network of arches will keep their lifetime longer during the recirculation of the pebble flow in the bed. Herein, all nearest neighbors around each particle
in the arch form the contact network in a two-dimensional packing (Fig. 2.44a). The
angles between the successive neighbors of the particle in each arch reflect the local
characteristics of the structure organization in the contacting particle network. These
angles are measured and their probability distribution is obtained by separating the
data into 36 bins centered every 10
◦ (0
◦ , 10
◦ , · · · , 350
◦ ) during the experimental time
of 3300 seconds.
As aforementioned, the arches in the ordered particle packing field (e.g., H =
24d, X = 24d) always keep longer lifetime than those with the same size in the disordered field (e.g., H = 30d, X = 0d) statistically. The formation of larger arches is
easier in the ordered system field, where the probability distribution of the horizontal
span is higher near 0.5d and 1d. This corresponds to the fact particles form a more
stable connection network with a hexagonally ordered packing. Consequently, more
than 70% of the angles are between 50
◦ and 70
◦ (Fig. 2.44b). By comparison, the
percentage of the angles near 60
◦ (PDF(α ≈60
◦ )) is much lower in the disordered
109
Fig. 2.43 Probability distribution of lifetime of arches with different size
of the vessel. A similar trend is observed in other streamlines in Fig. 2.39. More
details about arch lifetimes and velocity fluctuations will be discussed in the next
section.
Arch Stability Analysis
A stable contact network of arches will keep their lifetime longer during the recirculation of the pebble flow in the bed. Herein, all nearest neighbors around each particle
in the arch form the contact network in a two-dimensional packing (Fig. 2.44a). The
angles between the successive neighbors of the particle in each arch reflect the local
characteristics of the structure organization in the contacting particle network. These
angles are measured and their probability distribution is obtained by separating the
data into 36 bins centered every 10
◦ (0
◦ , 10
◦ , · · · , 350
◦ ) during the experimental time
of 3300 seconds.
As aforementioned, the arches in the ordered particle packing field (e.g., H =
24d, X = 24d) always keep longer lifetime than those with the same size in the disordered field (e.g., H = 30d, X = 0d) statistically. The formation of larger arches is
easier in the ordered system field, where the probability distribution of the horizontal
span is higher near 0.5d and 1d. This corresponds to the fact particles form a more
stable connection network with a hexagonally ordered packing. Consequently, more
than 70% of the angles are between 50
◦ and 70
◦ (Fig. 2.44b). By comparison, the
percentage of the angles near 60
◦ (PDF(α ≈60
◦ )) is much lower in the disordered